


It's 4:47pm on a Friday at a small social enterprise. You — the only web developer on staff — are exporting a CSV from the donation platform, opening it in a spreadsheet, vlookup-ing it against the CRM export from yesterday, and pasting the result into a Google Sheet that the executive director will screenshot for tomorrow's board meeting. You've done this every Friday for fourteen months. The board never asks how the data got there. They just want the chart. And next Tuesday, the program manager will email asking why beneficiary numbers don't match what the impact report shows.
Imagine that developer is running a stack any social enterprise might recognize: a WordPress site, a donation processor like Donorbox or Stripe, a CRM (often a hand-rolled Airtable or a discounted Salesforce instance via the Power of Us program), an email tool, and a separate impact-tracking spreadsheet. None of them talk to each other. The developer would, over a year, become the human integration layer — and that role would silently absorb 30-50% of their week, leaving the actual product roadmap stalled. The pattern we want to illustrate: in a lean social enterprise, the bottleneck on revenue growth is rarely the website. It's the operational seams between systems.
The Hidden Problem: You're Funding a Human Cron Job
Social enterprises operate under a constraint that most for-profit tech writing ignores: the developer headcount is fixed and small, often one or two people, sometimes zero. Yet the number of systems that need to talk to each other — donations, CRM, email, beneficiary management, accounting, board reporting, grants compliance — keeps growing. Every new funder wants their own report format. Every new program adds its own intake form.
The result is what the M+R Benchmarks report on nonprofit digital fundraising has consistently shown over multiple years: organisations that invest in integrated digital infrastructure see materially higher year-over-year online revenue growth than those who don't. Read against the social-enterprise reality, this implies the constraint isn't lack of mission, audience, or generosity — it's the operational tax of running on disconnected tools. Our reading: every CSV export is a tiny tax on revenue capacity.
KEY TAKEAWAYS
The web developer in a lean social enterprise is the de facto integration layer. Manual data movement between disconnected tools consumes 30-50% of dev capacity in our experience.
Revenue impact comes from replacing recurring manual work, not building new features. One well-chosen integration replaces a recurring weekly task — and frees the dev for revenue-bearing work.
Most operational pain is bunched around four seams: donation-to-CRM, CRM-to-email, programme-to-impact-report, and finance-to-board-deck.
The artefacts that drive revenue are dashboards, not landing pages. Boards fund what they can see; donors return when feedback loops are visible.
Patterns We Observe in the Wild
We won't claim a single hero case here — every social enterprise's stack is its own snowflake. Instead, two patterns we see repeat across engagements, and one community voice that names the texture of it.
Pattern 1 — the "successful pilot, broken second year". Imagine a community-development organisation that wins a small grant to digitise its beneficiary intake. The pilot would launch beautifully: a clean form, a tidy database, an enthusiastic programme lead. By year two, three more programmes would request "their own version", each with slightly different fields. The developer would now maintain four near-identical forms feeding four near-identical tables. By year three, the fundraising team would be unable to answer "how many unique beneficiaries did we serve last year?" without two days of manual reconciliation. The pattern: success, in social enterprises, exposes integration debt faster than failure does.
Pattern 2 — the "donor-export gap". Consider a hypothetical mission-driven enterprise selling a low-margin physical product where 40% of orders come from supporters who also donate. The dev would ship a Shopify-style storefront, the fundraising team would run a separate donation page, and the email tool would treat the two audiences as unrelated lists. The org would discover, six months later, that the highest-LTV cohort — donor-buyers — was being marketed to twice with conflicting messages. The pattern: when commerce and philanthropy run on parallel rails, the org under-monetises the overlap.
Tech allows lean teams to reach wider audiences, improve operations, and showcase transparency.
, Blog Post
The community voice above gets the optimism right but elides the cost: which platforms, glued together how, by whom. That's the developer's question, and the rest of this article is a playbook for answering it.
The Pattern: Treat Your Ops Stack As A Product
The teams that escape the human-cron-job trap have one thing in common: they stopped treating internal tools as a backlog of one-off requests and started treating them as a product with a roadmap. The Stanford Social Innovation Review's ongoing coverage of nonprofit operations has repeatedly highlighted the same finding — operational maturity, not fundraising creativity, predicts which mission-driven organisations sustain growth past the early-stage hump.
From our work with social enterprise teams: the developers who move the revenue needle aren't the ones writing the prettiest React components. They're the ones who pick a single recurring manual workflow each quarter and delete it — by integration, by automation, or by changing who owns it. After four quarters, the org has compounded back roughly a full developer-month per year and the leadership team can finally see its own data without asking.
The shift is one of stance. You stop being the person who runs the export and start being the person who designs the system that makes the export unnecessary. Most teams treat this as a tooling problem. It's an ownership problem.
The diagram below contrasts the two operating modes side-by-side:
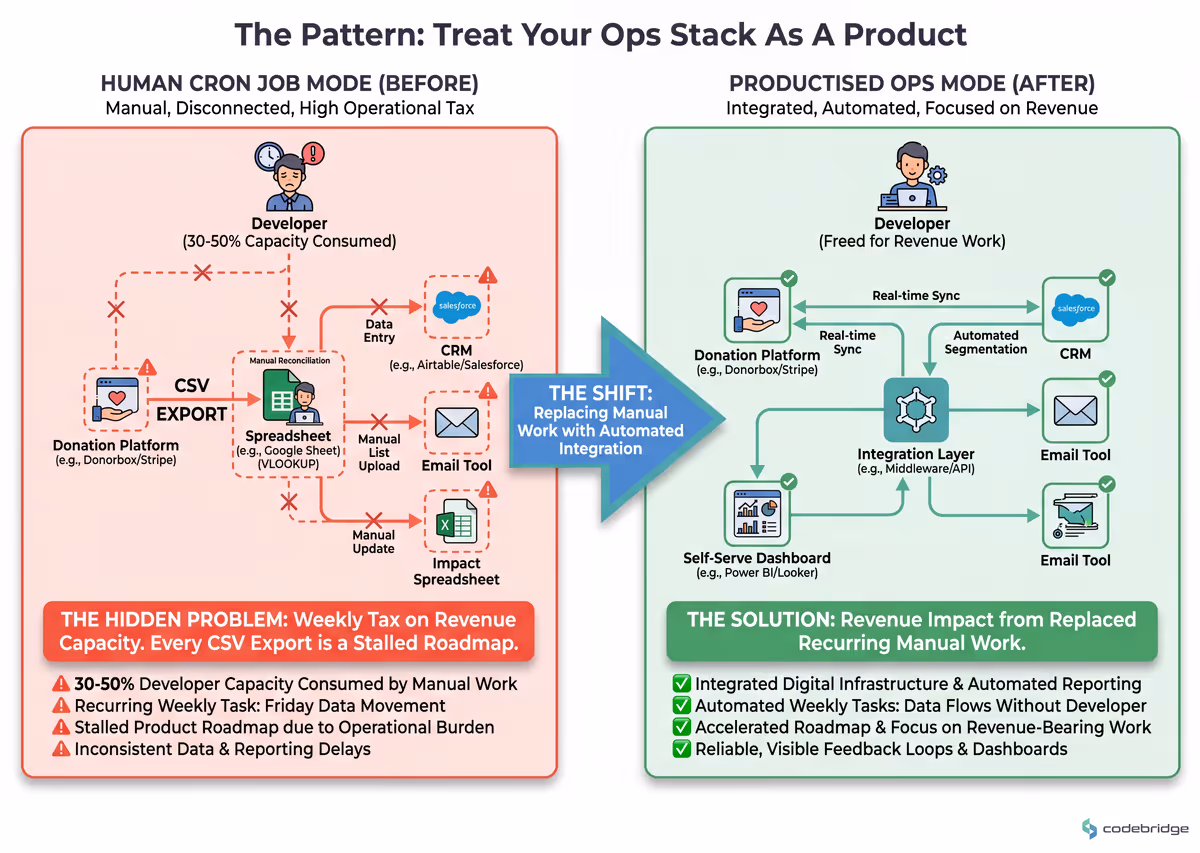
On the left, "Human Cron Job" mode: developer manually exports, reconciles, and emails reports weekly. On the right, "Productised Ops" mode: integrated stack with self-serve dashboards. The hidden cost lives in the left column: every Friday the dev loses to the export is a Friday not spent on revenue work.
The Playbook: Six Steps For The Next Quarter
Sequenced by use, not by glamour. Each step is designed to be executable by a single web developer, with leadership buy-in but without new headcount.
Step 1 — Run a "Human Cron Job" audit (Week 1)
List every recurring manual task you, the developer, perform on a weekly or monthly cadence. For each, record: cadence, time per occurrence, the system it bridges, and whether the output is read by ≥1 decision-maker.
What good looks like: a list of 8-15 items. Anything fewer means you're underreporting; anything more means you're already drowning.
Threshold: any task taking >30 min/week or >2 hrs/month is a candidate for replacement. Sort by annual hours saved.
Common failure mode: excluding "tasks that feel small". The Friday dashboard refresh that takes 20 minutes is 17 hours a year — half a sprint week.
Step 2 — Pick one seam and one integration (Week 2)
Choose the highest-volume seam from your audit. The four most common in social enterprises: donation-to-CRM, CRM-to-email, programme-data-to-impact-report, finance-to-board-deck. Pick the integration tool that fits your stack — Make.com, n8n (self-hosted), Zapier, or a direct webhook — and commit to one workflow.
What good looks like: a written one-page integration spec — input schema, output schema, error handling, who owns the credentials.
Worked example: if your highest-LTV cohort is 200 donors/month and each one currently requires a 2-minute manual sync, that's 6.6 hours/month. Even a $50/month integration tool returns its cost in hour one.
Step 3 — Establish a single source of truth for people (Weeks 3-4)
Decide which system holds the canonical record for a "person" — donor, beneficiary, volunteer, customer, or all of the above. Every other system reads from or syncs to that one.
Pattern: store identity in your CRM, store transactional state in the systems that own it (donations in the donation tool, orders in commerce, programme participation in your intake DB), and join via a stable external ID. Never let two systems independently mutate the same field.
Measurable signal: if someone updates their email in two places, which one wins? If you can't answer in one sentence, you don't have a single source of truth yet.
Step 4 — Replace exports with read-only dashboards (Weeks 5-6)
Every recurring report someone screenshots is a dashboard waiting to be built. Use Metabase (open-source, free), Grafana, or a hosted BI layer the org can afford. The dashboard reads directly from the source of truth from Step 3.
What good looks like: the executive director opens a URL on Tuesday morning instead of asking you for a number on Monday afternoon.
Threshold: if a question is asked >3 times in a quarter, it deserves a dashboard tile.
Step 5 — Instrument one revenue funnel full (Weeks 7-8)
Pick the single funnel that drives the most revenue — recurring donations, product sales, grant-application landing page, whatever it is — and instrument every step. Use a privacy-respecting analytics layer (Plausible, Fathom, or self-hosted PostHog) and surface the funnel on the same dashboard from Step 4.
Worked example: if 1,000 visitors land on the donation page monthly, 40 start the form, and 20 complete it, the leak is the start step (4% activation). One A/B test on the form CTA is worth more than three new blog posts.
Consider the funnel below:
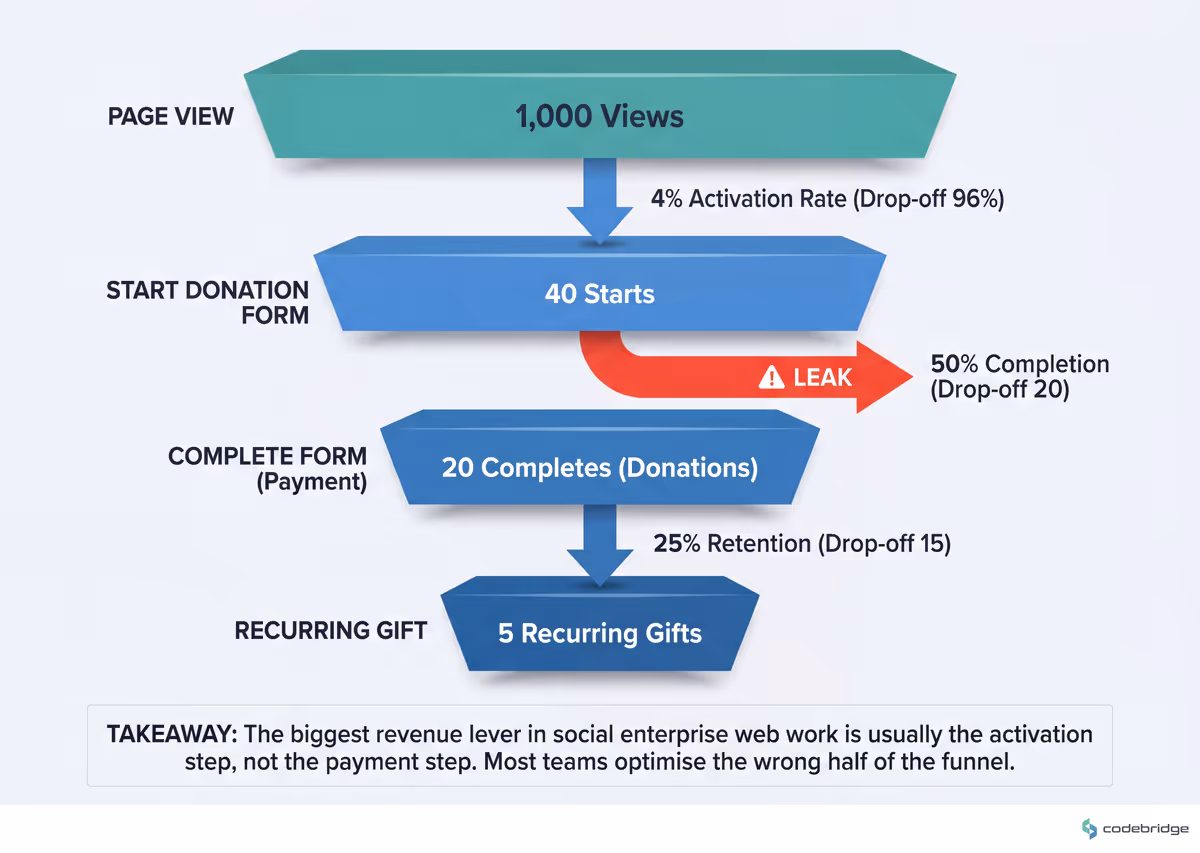
Donation funnel from page view to recurring gift, with the typical leak point at the start-form step. The takeaway: the biggest revenue lever in social enterprise web work is usually the activation step, not the payment step — most teams optimise the wrong half.
Step 6 — Schedule the monthly ops review (Week 9 onward)
Once dashboards exist, defend them with a 30-minute monthly review with leadership. Walk through funnel metrics, integration health, and the next item on the audit list. This converts the developer's work from invisible plumbing to visible revenue contribution.
Common failure mode: skipping this step because "the dashboards speak for themselves". They don't. The review is what converts technical work into political capital — which is what funds the next quarter's roadmap.
Closing The Loop
Back to that Friday afternoon export. After one quarter of this playbook, the developer at our hypothetical organisation would no longer touch the spreadsheet. The board chart would refresh from a Metabase dashboard reading the CRM directly. The Tuesday email about beneficiary mismatch would never get sent, because the impact tracker and the CRM would share an external ID. And the developer would have the second half of every Friday back — to ship the donor self-service portal that's been on the roadmap since spring.
Tomorrow morning (Monday): open a blank doc and start the Step 1 audit — list every recurring manual task. Give yourself an hour. Wednesday: sort the list by annual hours and circle the top three. By Friday: walk the top item to your executive director with a one-line proposal — "I want to spend two weeks replacing this. Here's what I'll deliver, here's the cost, here's the time it gives back." That conversation is the artefact. Everything else is execution.
Stuck on which integration to pick first?
Talk to our team about a one-week ops audit for your social enterprise stack.
Diagnostic Checklist: Where Are You On The Curve?
Run these against your current setup. Three or more "yes" answers means the playbook is overdue.
Do you, the developer, manually export data from one system and import it into another at least weekly? Yes / No
If your executive director asked "how many unique people did we serve last year?", would the answer take more than 30 minutes to produce? Yes / No
Do two or more systems independently store a "person's email" with no sync rule between them? Yes / No
Is there a recurring report whose latest version lives only as a screenshot in someone's inbox? Yes / No
Does your highest-revenue funnel lack instrumentation past the page-view stage? Yes / No
Is there a critical workflow that would break if you, specifically, took two weeks of leave? Yes / No
Has a new programme or grant added a "small" intake form in the last six months that is now siloed from the main CRM? Yes / No
REFERENCES
M+R Benchmarks — Annual nonprofit digital fundraising and engagement report
Stanford Social Innovation Review — Nonprofit operations and management research
NTEN — Nonprofit Technology Network
TechSoup — Technology resources and research for mission-driven organisations
CAP Enterprise — Unlocking the secrets to sustainable business models for social enterprises
FundsforNGOs — How can social businesses use technology to improve operational efficiency


Heading 1
Heading 2
Heading 3
Heading 4
Heading 5
Heading 6
Lorem ipsum dolor sit amet, consectetur adipiscing elit, sed do eiusmod tempor incididunt ut labore et dolore magna aliqua. Ut enim ad minim veniam, quis nostrud exercitation ullamco laboris nisi ut aliquip ex ea commodo consequat. Duis aute irure dolor in reprehenderit in voluptate velit esse cillum dolore eu fugiat nulla pariatur.
Block quote
Ordered list
- Item 1
- Item 2
- Item 3
Unordered list
- Item A
- Item B
- Item C
Bold text
Emphasis
Superscript
Subscript