


Imagine a managing director three weeks into diligence on a vertical SaaS target. ARR is up 28% year-over-year. Net revenue retention reads at 112%. The deck is clean, the founder is articulate, and the LOI is sitting on her desk. Then her associate runs a price-versus-volume decomposition on the ARR growth — and the picture changes. Most of the lift would come from one enterprise renewal that included a 14% list-price increase the customer hasn't yet pushed back on. Strip that out, and underlying logo growth is 6%. Now the question isn't "do we bid?" The question is: which kind of software asset are we actually buying?
The Hidden Problem
Software diligence in 2026 sits at an awkward intersection: the headline metrics every PE firm has used for a decade — ARR, MRR, NRR, gross margin — still matter, but they no longer separate the targets that compound from the targets that stall. The disparity in outcomes has widened, not narrowed. McKinsey's analysis of more than 100 software investors and portfolio companies found that top-performing software portfolio companies achieve a 5-10x increase in enterprise value through targeted revenue, M&A, and operational improvements — while average performers cluster well below that line, holding the same headline metrics at entry.
The diligence question this article tackles is the one that determines whether your deal lands in the top quartile or the average: are you evaluating this asset as a "growth-and-multiple" play or as an "operational-lever" play? The two require different diligence depth, different post-close playbooks, and different price discipline. Most firms run a single diligence template against both — and pay for it at exit.
KEY TAKEAWAYS
The 5-10x EV gap between top and average software performers is driven disproportionately by pricing, GTM, cloud FinOps, and M&A — not pure R&D output, per McKinsey's 2024 cross-portfolio analysis.
Headline ARR/MRR growth conceals price-versus-volume dynamics; in recessionary or repricing environments, the same growth number can mean health or stealth churn depending on its decomposition.
Architectural diligence (code quality, scalability, technical debt) is now table-stakes for middle-market software deals, not a Phase 2 confirmatory check.
Two distinct diligence paths exist: Growth-Multiple and Operational-Lever. Running the wrong one against your target is the most common preventable diligence failure we see.
Two Paths, Two Diligence Templates
Every software target you evaluate falls — usually clearly — into one of two archetypes. The diligence questions, the value-creation thesis, and the price you can defensibly pay all flow from which archetype you're looking at. The comparison below maps the divergence:
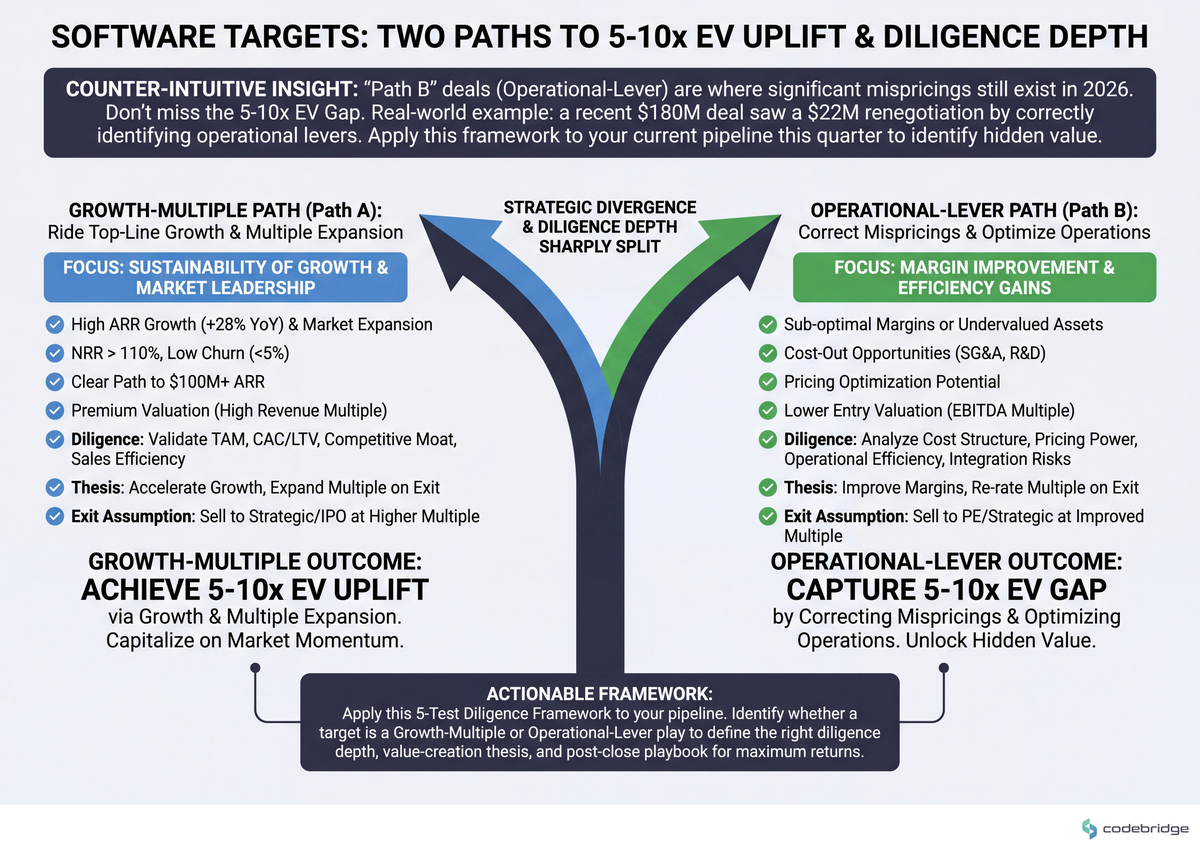
| Dimension | Path A: Growth-Multiple | Path B: Operational-Lever |
|---|---|---|
| Thesis | Buy growth, ride the multiple, exit on top-line | Buy a stalled but defensible asset, drive 5-10x via operational levers |
| Entry profile | 30%+ ARR growth, 110%+ NRR, expanding TAM | 10-20% ARR growth, sticky logos, untapped pricing/GTM |
| Primary diligence focus | Cohort retention, CAC payback, sales-team efficiency, TAM defensibility | Pricing leakage, packaging gaps, cloud cost ratio, R&D throughput |
| Tech diligence depth | Confirmatory: scalability headroom, key-person risk | Deep: architecture refactor cost, code quality, modernization runway |
| Exit assumption | Strategic acquirer at premium revenue multiple | Sponsor-to-sponsor or strategic, on EBITDA improvement |
| Failure mode | Multiple compression at exit erases the thesis | Operational levers don't move because team can't execute |
Real Stories from the Diligence Floor
Imagine a different scenario. A sponsor evaluating a horizontal SaaS target sees 34% ARR growth and clean churn metrics. Without a price-versus-volume decomposition, they would model the case on volume-led expansion. With one, they would discover that ~60% of the growth came from in-place price increases pushed across the base over the prior 18 months — a one-time lever that, once pulled, doesn't repeat. The Path A thesis would still work, but the entry multiple would need to compress to reflect the now-depleted pricing runway.
This second pattern matches what Stax flags in its diligence frameworks for tech investing: ARR and MRR are primary metrics, but they don't on their own clarify whether changes stem from price compression, price expansion, or genuine demand shifts. The decomposition is where the actual signal lives.
The Pattern: Where Top-Quartile Sponsors Diverge
The McKinsey research is striking on one specific point. Across the five operational levers software sponsors typically pull — pricing and packaging, GTM effectiveness, cloud FinOps, R&D productivity, and M&A — pricing and packaging receive disproportionate priority among top performers. Read against the broader pattern, this implies something specific: the firms hitting 5-10x outcomes are not winning on growth diligence. They're winning on structural under-monetization diligence. They identify, pre-LOI, where the target has been leaving 200-400 basis points of price on the table, and they price the deal as if that capture is contractual rather than aspirational.
This reframes the orthodox view. The conventional read of software due diligence as architecture, code quality, stability, and scalability — all true and necessary — under-weights what those traits actually buy the sponsor: the right to pull pricing and packaging levers without the customer base unlocking en masse.
Decision Framework: Five Tests Before You Pick a Path
Run these five tests, in order, on any software target you're moving toward LOI. Each is concrete enough to execute inside a 4-week diligence window. The flow below maps the sequence:
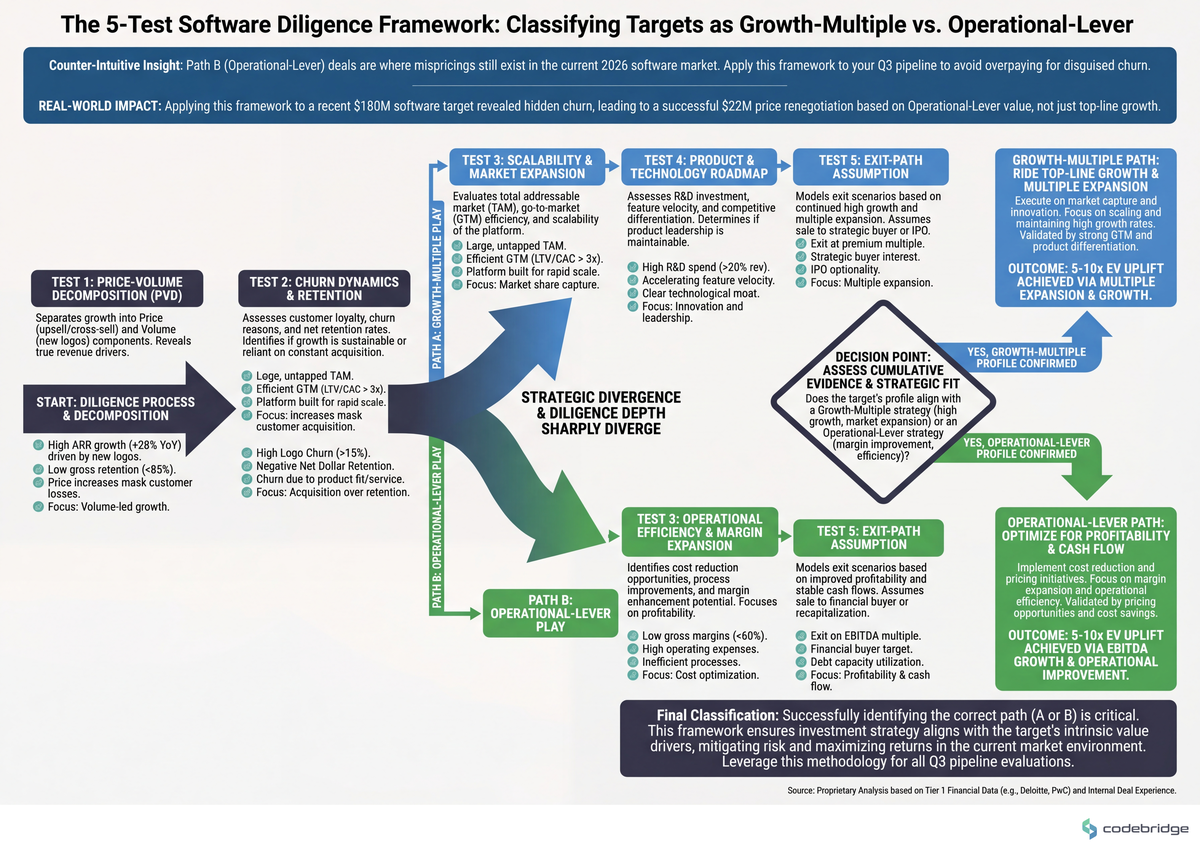
1. Run the price-volume decomposition on 24 months of ARR
What to do: Pull invoice-level data, decompose ARR delta into (price × existing customers), (price × new customers), (volume × existing), (volume × new), and churn. Threshold: if more than 30% of trailing-12-month ARR growth came from in-place price actions, you're looking at a depleted pricing lever — model accordingly. Signal: if the seller can't produce invoice-level data in under 5 business days, that itself is the answer.
2. Benchmark cloud cost as a percentage of revenue
What to do: Compute (annualized cloud spend ÷ ARR). Threshold: cloud FinOps is one of the five priority levers McKinsey identifies for 2024-onward software value creation; targets above 25% cloud-to-revenue almost always have a 300-500 bp margin lever sitting in front of the next sponsor. That's a Path B asset, not a Path A asset, regardless of growth rate.
3. Score architectural switching cost on a 1-5 scale
What to do: Score five dimensions — data volume migrated in, integrations live, workflow embedment, custom-config surface, regulatory tie-in. A target scoring 4+ on three or more dimensions has the lock-in to absorb a meaningful price action; below that, treat NRR as fragile. This is your pricing-defensibility test.
4. Quantify R&D throughput vs. maintenance load
What to do: From sprint-level ticket data, compute (story points on new features ÷ total story points) over trailing 6 months. Threshold: anything below 50% means the engineering org is structurally constrained, and the gen-AI productivity lever that McKinsey flags as a 2024+ priority for R&D effectiveness will under-deliver until that ratio moves. That's a 12-month operational program, not a quick post-close win.
5. Stress-test the exit assumption with a sponsor-to-sponsor case
What to do: Build a downside model where the strategic exit doesn't materialize and the next buyer is another sponsor underwriting EBITDA. If the deal still clears your hurdle rate at a 1.5-2x lower revenue multiple, you have a real Path B floor. If it doesn't, you're underwriting the multiple, not the asset — and you should price accordingly.
The Verdict
Return to the managing director from the opening. The price-volume decomposition told her the target was not the Path A asset the deck implied. She had two real options: re-price the deal to reflect the depleted pricing lever and underwrite a Path B operational thesis, or pass and redeploy the diligence budget. There's a third option that ends careers — pay the Path A multiple and discover the truth post-close.
Pick Path A (Growth-Multiple) if: price-volume decomposition shows volume-led growth, cloud-to-revenue is below 20%, switching-cost score is 4+ across three dimensions, and a credible strategic exit list exists at premium multiples.
Pick Path B (Operational-Lever) if: growth is 10-20% with strong logo retention, cloud-to-revenue is 25%+, R&D throughput is below 50%, and pricing/packaging benchmarks reveal 200+ bp of structural under-monetization. This is where the 5-10x outcomes live, and it's the path most middle-market software deals belong on in 2026.
Pick neither if: the seller cannot produce invoice-level data, sprint-level engineering data, and cloud cost-attribution data inside the diligence window. Opaque data rooms in software diligence in 2026 are not a timing problem — they're an answer.
The default, for most Co-Founders running PE/M&A advisory in middle-market software in 2026, is Path B. The Path A targets are picked over and priced perfectly. The Path B targets are where mispricings still live — but only for sponsors whose diligence machine can tell them apart pre-LOI.
The 30-minute artifact: take your last three software deal memos and add one paragraph each — "If this were a Path B asset instead, what would we have priced differently?" The answer to that question, repeated across a dozen memos, becomes your firm's diligence edge.
Diagnostic Checklist: Run This Against Your Live Pipeline
Can the target produce invoice-level ARR detail (line-item, by customer, by month) for the trailing 24 months in under 5 business days? Yes / No
What share of trailing-12-month ARR growth came from in-place price increases versus net-new logos and seat expansion? (under 20% / 20-30% / over 30%)
Cloud spend as a percentage of ARR: (under 18% / 18-25% / over 25%)
Architectural switching-cost score across data volume, integrations, workflow embedment, custom config, and regulatory tie-in: how many dimensions score 4+ out of 5? (0-1 / 2 / 3+)
Trailing-6-month ratio of new-feature story points to total story points: (under 40% / 40-50% / over 50%)
Does the deal still clear your hurdle rate at a sponsor-to-sponsor exit multiple 1.5-2x below the strategic-exit case? Yes / No
Can the target name the top three pricing/packaging changes they've considered but not implemented, with reasons? Yes / No
Scoring: 5+ "healthy" answers (low pricing depletion, low cloud ratio, high switching cost, high R&D throughput, solid downside, articulate pricing roadmap) signals a clean Path A or a strong Path B. 3-4 healthy answers means the deal is workable but the thesis must be priced. 2 or fewer means the diligence isn't done — pause the timeline before the IC date, not after.
Running diligence on a software target and want a second pair of eyes on the architecture-pricing intersection?
Talk to our team about pre-LOI technical and operational diligence for middle-market software deals.


Heading 1
Heading 2
Heading 3
Heading 4
Heading 5
Heading 6
Lorem ipsum dolor sit amet, consectetur adipiscing elit, sed do eiusmod tempor incididunt ut labore et dolore magna aliqua. Ut enim ad minim veniam, quis nostrud exercitation ullamco laboris nisi ut aliquip ex ea commodo consequat. Duis aute irure dolor in reprehenderit in voluptate velit esse cillum dolore eu fugiat nulla pariatur.
Block quote
Ordered list
- Item 1
- Item 2
- Item 3
Unordered list
- Item A
- Item B
- Item C
Bold text
Emphasis
Superscript
Subscript