NEW YEAR, NEW GOALS:   Kickstart your SaaS development journey today and secure exclusive savings for the next 3 months!
Check it out here >>
White gift box with red ribbon and bow open to reveal a golden 10% symbol, surrounded by red Christmas trees and ornaments on a red background.
Unlock Your Holiday Savings
Build your SaaS faster and save for the next 3 months. Our limited holiday offer is now live.
White gift box with red ribbon and bow open to reveal a golden 10% symbol, surrounded by red Christmas trees and ornaments on a red background.
Explore the Offer
Valid for a limited time
close icon
Logo Codebridge
AI

What Is AI Agent Observability? Metrics, Tracing, and the Visibility Gap in Agentic AI Systems

Konstantin Karpushin
June 11, 2026
|
13
min read
Share
text
Link copied icon
table of content
Man with short brown hair and beard wearing a white collared shirt against a dark background.
Myroslav Budzanivskyi
Co-Founder & CTO

Get your project estimation!

When an AI agent produces the final answer, the next step is to explain how the agent got there. Unfortunately, many teams can’t reconstruct the path the agent took, the context it retrieved, the tools it called, and the business action it triggered at the end.

KEY TAKEAWAYS

AI agent observability is not just LLM monitoring. It shows the full execution path of an agent: what it saw, what context it used, which tools it called, what it changed, where it failed, and whether the system should have allowed that action.

Metrics show symptoms, but traces explain behavior. Latency, cost, errors, and tool-call rates are useful, but they do not explain why an agent made a wrong decision. End-to-end tracing shows the step where the problem entered the workflow.

The more autonomy an agent has, the more observability it needs. A chatbot can be reviewed by reading the final answer. An agent connected to CRM, EHR, billing, support, or internal tools needs audit trails, permissions, guardrails, evaluation, and human override paths.

Observability must be designed before production, not added after launch. A dashboard cannot show tool calls, context choices, approvals, or memory updates that were never recorded. For production AI agents, observability is part of the architecture, not a reporting layer added later.

That blind spot is called a visibility gap. It is the distance between what an agent did and what its operators can account for afterward. With a chatbot, the gap costs little, because reading the reply tells you most of what you need to know. With an agent that pulls records from a CRM, writes to a billing system, or updates a patient chart, the reply is the smallest part of what happened.

The gap is widening on the clock. Deloitte's 2026 State of AI in the Enterprise report found that 74% of organizations expect to use AI agents at least moderately by 2027, while only 21% report a mature governance model for those agents. Teams are granting agents autonomy faster than they can explain it. 

Gartner estimates the cost of this imbalance, predicting that more than 40% of agentic AI projects will be canceled by the end of 2027 due to escalating costs, unclear business value, or inadequate risk controls.

Observability is the control layer between those two numbers. If you build it into the architecture as soon as possible, an autonomous system will stay inspectable. However, if it is added after launch as a dashboard, the evidence you need most may already be missing. 

AI Agent Observability: The Short Answer

AI agent observability is the practice of tracing, measuring, evaluating, and monitoring how an AI agent behaves across a full workflow. It records the model calls, prompts, retrieved context, tool calls, memory operations, handoffs, guardrail checks, latency, cost, errors, human overrides, and business outcomes that make up a single agent run.

It departs from basic LLM observability in the way that counts. A language model generates text, so watching the prompt and the completion covers most of the exposure. An agent acts. It calls tools, reaches into external systems, and changes data, so observability has to follow those actions rather than only the words around them.

Reduced to one sentence, AI agent observability is the ability to reconstruct what happened during an agent run: what the user asked, what context the agent used, which model and prompt version responded, which tools it called, what it changed, what failed, what it cost, and where a human stepped in.

What Is AI Agent Observability?

AI agent observability diagram showing an agent run captured from input through context, model and prompt, tools, approval, and output, with traces, metrics, logs, cost, latency, and failure markers recorded in a replayable trace.
AI agent observability records what happened during an agent run so teams can inspect behavior after the fact. A replayable trace shows the context used, model and prompt version, tools called, systems touched, approvals, cost, latency, failures, and final output.

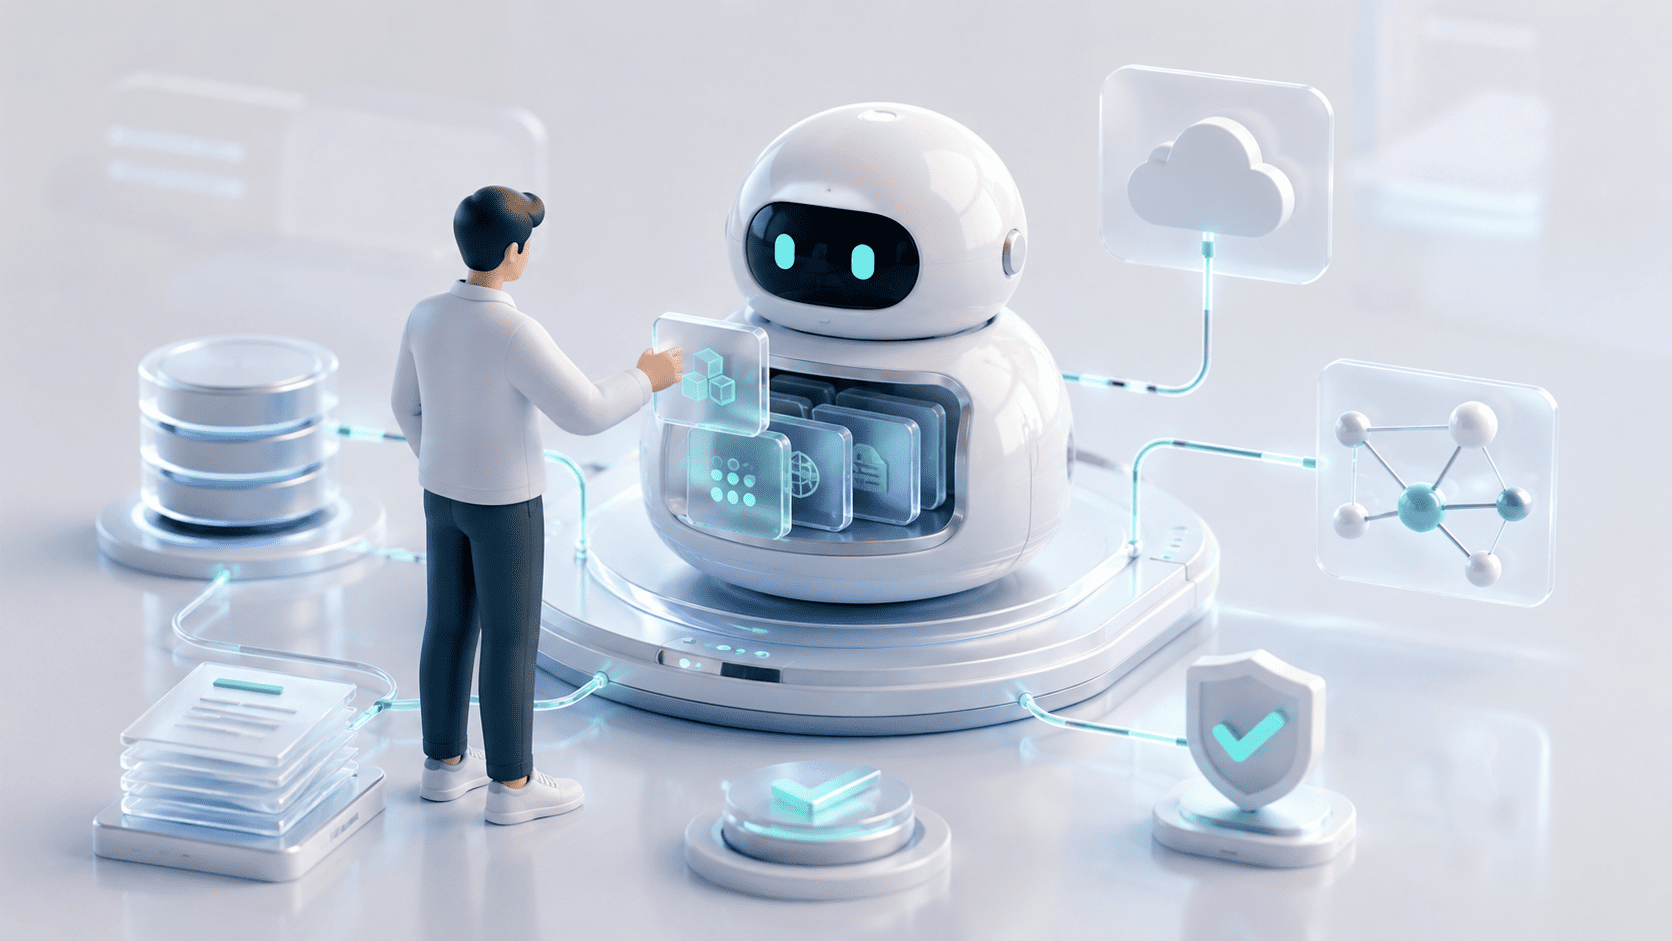
AI agent observability is the production visibility layer for systems where a language model is wired into tools, data, memory, APIs, workflows, and human approvals. Remove the model from that description, and you are left with ordinary distributed software, which engineering teams already know how to watch.

Conventional observability rests on three signals: traces that follow a request as it moves through a distributed system, metrics that count what the system does, and logs that record discrete events. OpenTelemetry, the open-source standard for cloud-native observability, exists to capture those signals in a consistent format. Agent observability takes the same machinery and points it at a harder target. A traditional request follows the code an engineer wrote and can read. An agent run follows the choices the model made at runtime, and any of those choices could have gone another way.

So the job shifts from confirming that code ran to reconstructing what the agent decided. A useful observability layer lets a team answer a specific set of questions about any single run:

  • What did the agent receive?
  • What context did it retrieve?
  • Which model and prompt version produced the response?
  • Which tools did it call?
  • What permissions did it rely on?
  • Which external systems did it touch?
  • Did it follow the intended workflow?
  • Did it escalate when the situation called for it?
  • Where did latency, cost, or failure show up?
  • Can the run be replayed, audited, and evaluated?

For architecture-first teams, the answers depend on decisions made long before launch. Once an agent connects to a CRM, an EHR, an LMS, or a billing platform, the trace structure, the permission model, the escalation path, and the evaluation loop are already set by how the system was built. Retrofitting that recording onto a system that never captured its own steps means rebuilding the system. Teams that can inspect their agents built the recording into the architecture rather than adding it after the fact.

AI Aagent Observability vs LLM Observability

Teams use the two terms as if they were the same. They cover different ground. LLM observability watches the interaction with the model. It includes the prompt that went in, the completion that came back, the tokens spent, the latency, and the cost. And it answers one question well: did the model produce a good response?

AI agent observability watches the execution path around the model. That same model call becomes one span inside a longer run that also includes retrieval, tool selection, tool inputs and outputs, memory reads and writes, guardrail checks, handoffs, retries, and the action the agent takes at the end. It answers a much broader question: did the system behave correctly across the entire workflow?

Dimension LLM observability AI agent observability
Main object A single model call A full agent run
What it tracks Prompt, completion, tokens, latency, cost Model calls, tool calls, retrieval, memory, handoffs, guardrails, workflow actions
Core question Did the model produce a good response? Did the system behave correctly across the workflow?
Typical failures Hallucination, high latency, an expensive prompt Wrong tool call, stale context, a retry loop, an unauthorized action, a failed handoff
Visibility needed Prompt-and-completion trace End-to-end execution trace
Business risk A bad answer A bad action: a wrong data update, a compliance breach, an operational failure

LLM observability does not become obsolete here, because a team still needs to know when the model hallucinated, slowed down, or ran an expensive prompt. Model-level visibility is necessary and, on its own, incomplete, because the model is now one component in a system that can act on the world. LLM observability tells you what happened around the model. AI agent observability tells you what happened around the model, the tools, the workflow, and the business action.

Recent research argues the same point from the evaluation side. A 2026 survey on execution provenance in LLM agents, From Agent Traces to Trust, finds that final-answer accuracy cannot fully explain how an output was produced because two runs that return the same answer can differ in reliability, safety, and auditability, and a correct answer can still come from an unnecessary or policy-violating tool call, none of which shows up in the final response.

Why AI Agents Create a Visibility Gap

The visibility gap is the central problem, and it comes from the fact that an AI agent works across steps, systems, tools, and permissions, and each step is a place the run can go wrong without changing how the output looks.

The Deloitte and Gartner findings from the opening describe this gap from the outside. Here is what it looks like from the inside. Follow one run end to end:

User request → retrieved context → prompt state → model decision → tool call → external system response → memory update → agent action → final output → business consequence

Every arrow is a handoff where something can break. If observability captures only the last box, the final output, the team loses the evidence that explains every box before it. The output can read as correct while the path that produced it was wrong.

The failures that hide in that path are concrete:

  • The agent retrieves stale or irrelevant context and reasons over the wrong facts.
  • The agent picks the wrong tool for the task.
  • A tool call succeeds technically and still produces the wrong business outcome.
  • The agent enters a retry loop and burns cost without making progress.
  • The agent skips a human approval the workflow required.
  • The agent exposes sensitive data.
  • The agent updates a CRM, a ticketing queue, an EHR, an LMS, or a billing record incorrectly.
  • The agent fails quietly, because no trace connects the final output to the steps that produced it.

Each of these can happen while the response reads as a success. The execution-provenance research makes the same observation: a correct answer can come from an unnecessary or policy-violating tool call, and final-answer accuracy will not surface it. OWASP names the version of this risk that bites once an agent can act. Its excessive agency category describes damaging actions taken in response to unexpected, ambiguous, or manipulated model output, made possible by excess functionality, permissions, or autonomy the system granted.

The visibility gap is not a missing dashboard. It is the inability to reconstruct the agent's path from context to action.

Core AI Agent Observability Metrics

AI agent observability metrics dashboard showing an agent run connected to six diagnostic metric categories: performance, LLM cost, context, behavior, governance, and business outcome.
AI agent observability should organize metrics around what teams need to diagnose in production. A useful dashboard connects each agent run to reliability, cost, context quality, agent behavior, governance risk, and business outcomes.

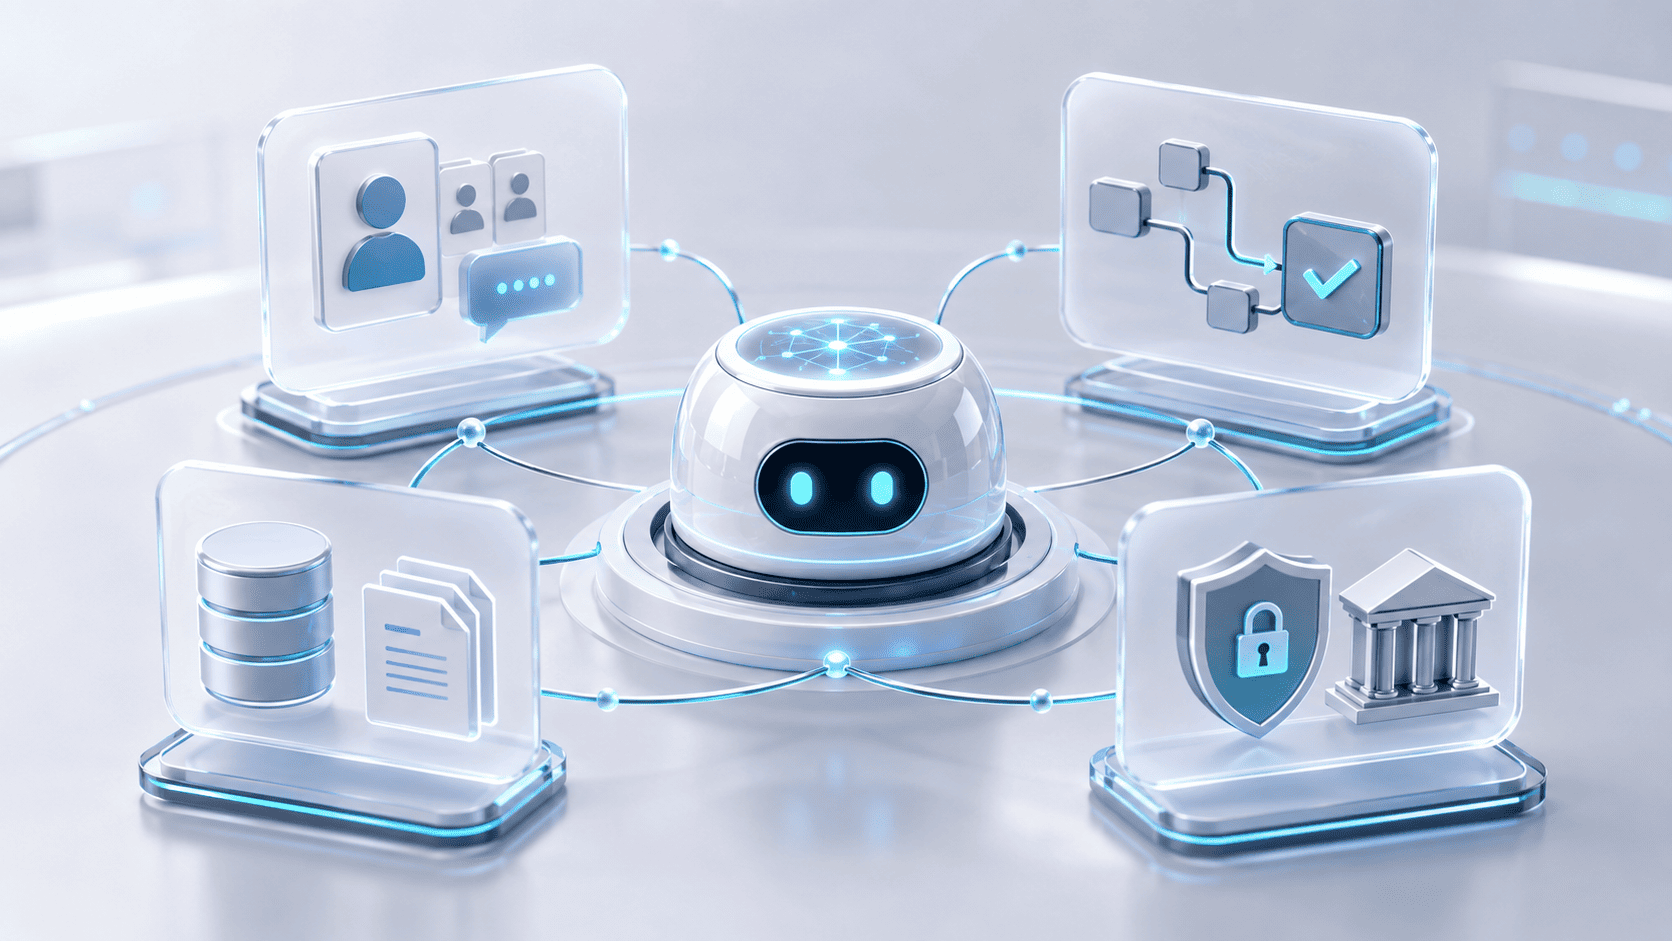
A list of forty metrics helps no one. A metric earns its place when it maps to a question a team needs answered, so the useful way to organize them is by what they diagnose. Six categories cover an agent in production.

Category What it diagnoses Representative metrics
System performance Whether the agent system is technically reliable Latency, throughput, error rate, timeout rate, retry rate, availability, queue time
LLM usage and cost Where tokens and money go, and under which configuration Input, output, and total tokens; cost per run; cost per completed workflow; model version; prompt version; temperature and configuration
Retrieval and context Whether the agent reasoned over the right material Context precision, context recall, context relevance, faithfulness, groundedness, answer relevance
Agent behavior Whether the agent chose and acted correctly Tool-call success, accuracy, failure, and retry rates; agent goal accuracy; loop rate; handoff rate; escalation rate; human override rate; task completion rate
Risk and governance Whether the agent stayed inside its authority Unauthorized tool attempts, sensitive-data exposure, policy-violation rate, guardrail-trigger rate, approval-bypass attempts, high-risk-action frequency, audit completeness
Business outcome Whether the workflow produced value Successful task completion, time saved per workflow, cost per resolved issue, revenue-workflow accuracy, ticket-deflection quality, CRM update accuracy, clinical or admin workflow completion, user correction rate

A few of these categories carry most of the diagnostic weight.

Retrieval and context metrics decide whether the agent reasoned over the right material. Ragas defines context precision as the retriever's ability to rank relevant chunks above irrelevant ones and pairs it with recall, faithfulness, and groundedness to separate a grounded answer from a confident guess. A wrong answer from correct retrieval points at the prompt. A wrong answer from bad retrieval points upstream, at the retrieval layer. The metric tells the team which one to fix.

Agent behavior metrics decide whether the agent chose and acted correctly. Ragas defines agent goal accuracy as a binary measure of whether the agent identified and achieved the user's goal. Tool-call accuracy, loop rate, handoff rate, escalation rate, and human override rate turn the agent's decisions into numbers a team can watch over time.

Risk and governance metrics decide whether the agent stayed within its authority. OWASP's excessive agency vulnerability is the reason this category exists. Unauthorized tool attempts, guardrail triggers, and approval-bypass attempts are early signals that an agent is reaching past its mandate, often before any single action causes visible damage. OpenTelemetry's GenAI conventions standardize the token-usage and model-call attributes the cost category depends on, which keeps these numbers comparable across tools.

The right set depends on the workflow. A sales-research agent and a radiology workflow assistant should not share a dashboard. One needs account-signal accuracy and CRM action traceability. The other needs data-access traceability, human-review coverage, and audit readiness. The metric that matters most is the one tied to the action the agent is allowed to take.

Tracing: The Most Important Layer

Metrics tell a team that something happened. Traces show how it happened, and that difference decides whether a failure can be diagnosed or only noticed.

A trace is the record of one agent run. A span is one operation inside that run: a model call, a retrieval, a tool invocation, a guardrail check. Stack the spans in order and the trace becomes the agent's account of its own work.

A useful agent trace records:

  • The user input
  • The system prompt and instruction version
  • Each model call
  • The documents or context retrieved
  • The tool selected, its inputs, and its outputs
  • Guardrail checks
  • Memory reads and writes
  • Handoffs between agents or steps
  • Retries
  • Errors
  • Human approvals
  • The final output
  • The business action taken

The OpenAI Agents SDK takes this approach in practice. Its tracing captures a record of an agent run across model generations, tool calls, handoffs, and guardrails, and OpenTelemetry standardizes the same spans so they travel into a team's existing observability stack. Tools such as Arize Phoenix capture model calls, retrieval, and tool use step by step.

Consider a concrete case. Codebridge built RecruitAI, a multi-agent recruitment platform for a US technology enterprise that cut time-to-hire from 24 days to 10 while keeping human oversight at every final decision. A run there is not one model call. The system screens a candidate, runs a technical validation, scores fit against a role, and hands a shortlist to a recruiter for the decision. If the shortlist is wrong, the cause could sit in any step: a screening prompt that over-weighted one signal, a validation tool that scored a test incorrectly, a stale role profile in retrieved context, or a handoff that dropped a flag the recruiter needed. A trace shows which one. A score alone shows only that the shortlist looked off.

A log says the agent failed. A trace shows where the failure entered the system.

Evaluation and Monitoring

Observability is not only watching production. The same traces and metrics should feed quality control: evaluation before release, monitoring after it, and human review for the runs that carry the most risk.

Offline evaluation runs before release. It tests the agent against known scenarios. Can it choose the right tool, refuse an unsafe action, escalate when it should, and answer only from approved sources? OpenAI's guidance on evals makes the case that generative systems are variable, so the testing methods built for deterministic software do not cover them. Anthropic frames an eval as a test with a defined input and grading logic that measures success, which is the discipline that keeps an agent's behavior from drifting between versions.

Online monitoring runs in production. It tracks real interactions, latency, cost, failures, user feedback, and drift, and it catches the problems that only appear once real users and real data reach the system.

Human review and calibration cover the high-risk workflows. People read traces, label failures, calibrate the scoring an LLM-as-judge produces, and approve changes before they ship. Ragas supplies the metrics that make this review repeatable across RAG and agentic workflows.

The three layers answer three different questions. Evaluation asks whether the agent was good enough. Monitoring asks whether it is still good enough in production. Tracing answers the question the other two raise: what exactly happened when it was not.

What an AI Observability Platform Should Actually Show

The market is full of AI observability platforms, and comparing them on features misses the point. A platform earns its keep by showing the full operational path of an agent, not a tidy log of prompts and responses.

A serious platform should surface:

  • End-to-end traces
  • Model calls, with prompt and model versions
  • Retrieved context
  • Tool calls, with inputs and outputs
  • Handoffs
  • Guardrail checks
  • Latency, token usage, and cost
  • Errors and retries
  • Evaluation scores
  • Human feedback
  • Business workflow status
  • Alerts
  • Role-based access, data masking, and redaction
  • Export into the team's wider observability stack

The platform matters, and the instrumentation design matters more. A dashboard cannot show a tool call, an approval step, or a memory update that the system never recorded.

Observability in Real Workflows: HealthTech, EdTech, SaaS

What an agent needs to show depends on what it can touch. A read-only assistant and an agent with write access to production data require different observability, even when they share a model. Four domains make the difference concrete.

HealthTech: auditability before autonomy

In a clinical setting, observability has to show what patient or clinical data the agent accessed, whether it made a suggestion or took an action, where a human reviewed the work, what got logged for audit, and whether sensitive data stayed protected. The NIST AI Risk Management Framework names the characteristics a trustworthy system has to demonstrate: valid and reliable, safe, secure and resilient, accountable and transparent, explainable and interpretable, privacy-enhanced, and fair. In healthcare, those are not aspirations. They are audit requirements.

Codebridge built RadFlow AI, an AI-powered radiology workflow assistant, against exactly this standard. It is a HIPAA-compliant diagnostic workspace integrated with existing PACS infrastructure, built to augment radiologists rather than replace them. 

Its results were validated by the client's Clinical AI Governance Board and an independent double-blind study: reporting time fell from 15.2 to 9.4 minutes per study across more than 4,800 CT cases, the system met a 93% acceptance threshold in a 2,400-case double-blind study, and false positives dropped from 4.1 to 0.4 per study. 

None of those numbers means anything without the observability behind them: the access logs, the human-review points, and the audit trail that let a governance board sign off in the first place.

EdTech: explain what shaped the response

A learning agent should show what content it used, whether the answer was grounded in approved material, how it adapted to the student, where its confidence dropped, and when a human should review. Retrieval and evaluation metrics from tools like Ragas and OpenAI's evals turn "the answer seemed fine" into a measurable claim about grounding and quality.

SaaS: observability across tenants, permissions, and integrations

A SaaS agent carries extra complexity: tenant isolation, role-based permissions, integration-specific tool behavior, customer-specific workflows, model and prompt versioning, and support escalation and rollback. The same agent can behave differently for two customers because their permissions and integrations differ, so observability has to hold that context per tenant rather than in aggregate.

For an architecture-first partner like Codebridge, this is the point where observability stops being a feature and becomes an architecture question. A production agent in HealthTech, SalesTech, EdTech, or SaaS is not a model wrapper. It is part of a workflow with users, permissions, data boundaries, integrations, audit requirements, and failure modes, and observability has to be designed around that workflow instead of being added as a generic dashboard later.

Executive Checklist: Before You Deploy an AI Agent

Autonomy is a decision, and it should not be made on faith. Before an agent gets the authority to act, the leadership team should be able to answer a specific set of questions. If the answers are not there, the autonomy is not ready.

Decision area What you should be able to answer
Visibility Can we trace every agent run end to end, see every model call, tool call, retrieval, handoff, retry, and guardrail event, and replay a failed run?
Context Can we see what data the agent used, detect stale or unauthorized context, and tell a grounded answer from an assumption?
Tools and permissions Do we know which tools the agent can call, are they limited by role and risk level, can the agent execute or only suggest, and which actions require approval?
Evaluation Do we have evals for normal, edge, and unsafe cases, are they tied to real traces, and do they test tool selection rather than only final answers?
Risk and governance Can we detect sensitive-data exposure and excessive agency, is there an audit trail, can a human stop the agent, and is ownership clear when it makes a mistake?
Business value Can we measure completed workflows rather than successful responses, cost per resolved task, and whether the agent improves speed, quality, revenue, support, or decision accuracy?

If the agent can act, the company needs proof of how it acted. Otherwise autonomy becomes a blind spot.

Conclusion

The rule is short. The more autonomy an agent has, the more observability the system needs. A chatbot can be reviewed by reading its response. An agent needs a record of the path it took.

Logs alone do not explain a failure. Metrics show what happened; traces explain how. Evals check quality before release; monitoring checks whether it holds in production. The platform matters, and the instrumentation design decides what can be observed at all. An agentic system needs this in place before it touches sensitive workflows, production data, or customer-facing actions, not after.

This is the argument the provenance research lands on: trust in an agent comes from being able to reconstruct what it did, not from a final answer that happened to be right. NIST frames the same idea as accountability and transparency. OWASP frames its absence as excessive agency. Gartner attaches the commercial cost to the projects that get canceled when autonomy outruns control.

Observability is not about watching AI more closely because teams distrust it. It gives an autonomous system the operational discipline already expected of any serious software. Once an agent can retrieve data, choose tools, update systems, or shape a decision, visibility becomes part of the product architecture. The price of autonomy is the ability to prove what happened.

Before an AI agent touches real workflows, a team should be able to trace what it sees, what it decides, and what it does. Codebridge designs agent architectures with tracing, evaluation, permissions, and production reliability built in from the start, so the visibility is there before the agent has the authority to act.

Deploying an AI agent soon?

Before it touches real workflows, check whether you can trace every model call, tool call, approval step, failure, and business action.

Book a domain-specific agent review

What is AI agent observability?

AI agent observability is the practice of tracing, measuring, evaluating, and monitoring how an AI agent behaves across a full workflow. It records model calls, retrieved context, tool calls, memory, handoffs, guardrails, cost, errors, human overrides, and business outcomes, so a team can reconstruct what an agent saw, decided, and did during any single run.

How is AI observability used?

AI observability is used to understand how an AI system behaves in real workflows, not only whether it produced an answer. Teams use it to trace model calls, monitor cost and latency, inspect retrieved context, detect failures, evaluate output quality, and understand where human review is needed.

In AI agent systems, observability becomes even more important because the agent may call tools, access company data, update systems, trigger workflows, or influence decisions. Observability helps teams answer practical questions: What did the agent see? Why did it choose this action? Which tool did it call? Did it follow the workflow? Where did the error start? Without this visibility, teams are often left judging the agent only by the final output, which can look correct even when the process behind it was wrong.

What is an AI agent observability example?

A simple example is a sales research agent that identifies target accounts, checks CRM data, enriches company information, drafts a message, and creates a follow-up task. AI agent observability would show each step of that run: the original request, the data retrieved, the model response, the tool calls, the CRM fields accessed, the message draft, the approval step, and the final action.

If the agent recommends the wrong account or creates a bad CRM update, the team should not have to guess what happened. The trace should show whether the error came from outdated CRM data, irrelevant retrieved context, a wrong tool call, a prompt issue, or a missing approval rule. That is the difference between simply seeing the output and actually understanding the agent’s behavior.

What’s the best tool for AI observability?

There is no single best AI observability tool for every team. The best choice depends on the architecture, risk level, data sensitivity, deployment model, and what the agent is allowed to do. A simple internal chatbot may only need prompt logs, latency, cost tracking, and basic evaluations. A production AI agent connected to CRM, EHR, billing, support, or workflow tools needs deeper tracing, access controls, redaction, evaluation, audit trails, and integration with the wider observability stack.

Common options include platforms such as LangSmith, Langfuse, Phoenix, Braintrust, OpenTelemetry-based setups, and broader observability tools that support GenAI telemetry. But the platform brand matters less than the instrumentation design. If the system does not record tool calls, retrieved context, handoffs, guardrails, and approvals, even the best dashboard will not show what actually happened.

What are the 4 pillars of observability?

For AI agents, the four practical pillars of observability are tracing, metrics, evaluation, and governance visibility.

Tracing shows the step-by-step execution path: model calls, retrieval, tools, handoffs, guardrails, and final actions. Metrics show system health, cost, latency, context quality, agent behavior, and business outcomes. Evaluation tests whether the agent behaves correctly before and after deployment. Governance visibility shows whether the agent stayed inside its authority, used approved data, respected permissions, and escalated when needed.

Traditional software observability often focuses on logs, metrics, and traces. AI agent observability needs more because agents do not only run code. They reason, retrieve, choose tools, interact with systems, and sometimes take action. That is why evaluation and governance visibility become part of the control layer.

What metrics should teams track for AI agents?

Teams should track AI agent metrics by what they diagnose, not as a flat list of numbers. Six categories cover most workflows: system performance, LLM usage and cost, retrieval and context, agent behavior, risk and governance, and business outcome.

System performance metrics include latency, error rate, timeout rate, retry rate, availability, and throughput. LLM usage and cost metrics include input tokens, output tokens, total cost per run, cost per completed workflow, model version, prompt version, and configuration. Retrieval and context metrics include context relevance, context precision, context recall, faithfulness, groundedness, and answer relevance.

Agent behavior metrics show whether the agent acted correctly: tool-call success rate, tool-call accuracy, loop rate, handoff rate, escalation rate, task completion rate, and human override rate. Risk and governance metrics show whether the agent stayed inside its boundaries: unauthorized tool attempts, sensitive-data exposure, policy violations, guardrail triggers, and approval bypass attempts. Business outcome metrics connect the system to value: time saved, cost per resolved task, workflow completion, user correction rate, conversion quality, or revenue impact.

The right metrics depend on what the agent is allowed to do. A sales agent and a clinical assistant should not have the same dashboard.

Why is tracing important for AI agents?

Tracing is important because metrics show that something happened, but a trace shows how it happened. A multi-step AI agent may retrieve context, call tools, use memory, hand off to another agent, trigger guardrails, retry a failed step, and then produce a final response. Without a trace, the team only sees the result, not the path.

When an agent produces a wrong result, the trace helps identify where the error entered the workflow. Maybe the retrieved document was stale. Maybe the tool returned bad data. Maybe the model chose the wrong next step. Maybe a human approval step was skipped. A log or metric may show that the run failed, but a trace shows the sequence that led to failure.

For production agents, tracing is the difference between debugging behavior and guessing.

What should an AI observability platform include?

An AI observability platform should include end-to-end traces, model and prompt versions, retrieved context, tool inputs and outputs, handoffs, guardrail checks, latency, token usage, cost, errors, retries, evaluation scores, human feedback, and business workflow status.

For production environments, it should also support role-based access, data redaction, audit trails, privacy controls, alerts, and export into the team’s wider observability stack. This matters because agent data can include sensitive prompts, customer records, internal documents, tool responses, and workflow actions.

The platform should not only show what the model answered. It should show what the agent did before the answer appeared.

How do evals relate to AI agent observability?

Evaluation, monitoring, and tracing form one loop. Evaluation asks whether the agent is good enough before release. Monitoring asks whether it is still good enough in production. Tracing answers what exactly happened when it was not.

For AI agents, evals should test more than final-answer quality. They should test whether the agent chooses the right tool, uses the right context, follows workflow rules, refuses unsafe requests, escalates when needed, and stays inside its authority. The strongest evals are connected to real traces because production failures reveal cases that synthetic tests often miss.

In simple terms: observability gives the evidence, and evals turn that evidence into quality control.

Why do AI agents need observability before production deployment?

AI agents need observability before production because once they can retrieve data, choose tools, update systems, or influence decisions, a wrong step can create real damage while the final output still looks reasonable. The risk is not only a bad answer. It is a bad action hidden inside a workflow.

Observability built into the architecture lets teams see what the agent accessed, why it acted, which tool it used, what failed, and when a human should intervene. It also makes the system auditable and easier to improve over time.

If observability is added after launch as a dashboard, the most important steps may never be recorded. You cannot inspect a tool call, approval step, retrieval decision, or memory update that the system did not capture in the first place.

What Is AI Agent Observability? Metrics, Tracing, and the Visibility Gap in Agentic AI Systems

Heading 1

Heading 2

Heading 3

Heading 4

Heading 5
Heading 6

Lorem ipsum dolor sit amet, consectetur adipiscing elit, sed do eiusmod tempor incididunt ut labore et dolore magna aliqua. Ut enim ad minim veniam, quis nostrud exercitation ullamco laboris nisi ut aliquip ex ea commodo consequat. Duis aute irure dolor in reprehenderit in voluptate velit esse cillum dolore eu fugiat nulla pariatur.

Block quote

Ordered list

  1. Item 1
  2. Item 2
  3. Item 3

Unordered list

  • Item A
  • Item B
  • Item C

Text link

Bold text

Emphasis

Superscript

Subscript

AI
Rate this article!
Thank you! Your submission has been received!
Oops! Something went wrong while submitting the form.
31
ratings, average
4.7
out of 5
June 11, 2026
Share
text
Link copied icon

LATEST ARTICLES

A vector image where people are sitting next to each other near the table and talking.
June 9, 2026
|
18
min read

Context Engineering vs Prompt Engineering: Why AI Agents Fail When You Treat Context Like a Prompt

Context engineering vs prompt engineering explained for AI agents. Learn when prompts are enough, when context architecture matters, and why agents fail without the right data, memory, tools, permissions, and observability.

by Konstantin Karpushin
AI
Read more
Read more
A big office where dozens of AI specialists are working.
June 8, 2026
|
9
min read

AI Agent Lifecycle Management: The Control Plane Behind Production AI Agents

Learn how AI agent lifecycle management controls production agents across ownership, identity, permissions, testing, observability, incidents, and retirement.

by Konstantin Karpushin
AI
Read more
Read more
The man and a woman are sitting on the weights, comparing options.
June 10, 2026
|
9
min read

Top Intelligent Automation Companies in 2026: Best Partners for Complex Workflows

Compare top intelligent automation companies in 2026 for complex workflows, AI agents, RPA, data automation, healthcare, SaaS, and custom software systems.

by Konstantin Karpushin
AI
Read more
Read more
People are looking for the best generative AI development company
June 5, 2026
|
12
min read

Top Generative AI Development Companies in 2026: Guide to Production-Ready AI Partners

The wrong AI partner gives you a shiny prototype, but the right one designs the architecture, workflows, and controls that make GenAI usable. Compare leading generative AI development companies by production readiness, AI services, and fit for SaaS, HealthTech, and SalesTech.

by Konstantin Karpushin
AI
Read more
Read more
The laptopscreen showing the business revenue graphs and charts.
June 4, 2026
|
11
min read

Revenue Operations Automation: How Manual CRM Work Leaks EBITDA

Manual CRM work quietly turns sales, RevOps, and finance teams into human middleware. Learn how revenue operations automation fixes lead-to-cash handoffs, reduces rework, and protects EBITDA across CRM, CPQ, ERP, and billing.

by Konstantin Karpushin
IT
Read more
Read more
The company director looks up at the light bulb and thinks about what to choose.
June 3, 2026
|
11
min read

In-House vs Outsourced AI Development: How to Decide Before You Hire

Before hiring a costly in-house AI team, learn how to decide whether your workflow should be built internally, outsourced, bought as SaaS, or validated first.

by Konstantin Karpushin
AI
Read more
Read more
Business consulting company choosing an AI vendor.
June 2, 2026
|
9
min read

Top AI Automation Consulting Companies in 2026: Best Alternatives to Big Consulting Firms

Compare top AI automation consulting companies in 2026 for scale-ups, mid-market teams, and enterprises seeking practical alternatives to Big Consulting firms.

by Konstantin Karpushin
AI
Read more
Read more
A man is looking at the creatively placed elements that represents AI network automation.
June 1, 2026
|
10
min read

AI Network Automation: How to Build Safe Automation Boundaries Before AI Touches Production Infrastructure

Learn how to build safe AI-driven network automation with approval flows, rollback logic, network observability, human-in-the-loop controls, and production infrastructure safeguards before AI executes changes.

by Konstantin Karpushin
AI
Read more
Read more
A business meeting in the conference room.
May 29, 2026
|
8
min read

Top AI Automation Companies for Complex Workflows and Production-Ready AI Agents

Compare the top 6 AI automation companies for complex workflows, production-ready AI agents, integrations, and custom AI automation beyond simple no-code tools.

by Konstantin Karpushin
AI
Read more
Read more
A man sitting next to the computer thinking how to manage the risk of AI agents.
May 28, 2026
|
8
min read

AI Agent Risk Management: The Architecture Behind Safe Automation

Learn how AI agent risk management works in production by designing access limits, tool permissions, human approvals, monitoring, fallback logic, and clear accountability before automation reaches real workflows.

by Konstantin Karpushin
AI
Read more
Read more
Logo Codebridge

Let’s collaborate

Have a project in mind?
Tell us everything about your project or product, we’ll be glad to help.
call icon
+1 302 688 70 80
email icon
business@codebridge.tech
Attach file
By submitting this form, you consent to the processing of your personal data uploaded through the contact form above, in accordance with the terms of Codebridge Technology, Inc.'s  Privacy Policy.

Thank you!

Your submission has been received!

What’s next?

1
Our experts will analyse your requirements and contact you within 1-2 business days.
2
Out team will collect all requirements for your project, and if needed, we will sign an NDA to ensure the highest level of privacy.
3
We will develop a comprehensive proposal and an action plan for your project with estimates, timelines, CVs, etc.
Oops! Something went wrong while submitting the form.