Many technology companies funding AI work face the same problem. The model performs in a sandbox, and the agent answers a clean question on a clean dataset. But then the CFO asks for the return on the budget, and the answer becomes a slide deck rather than a number.
McKinsey's State of AI survey reports that 88% of organizations use AI in at least one business function, while only 39% can point to a measurable EBIT impact at the enterprise level. It proves that pilots are successful in isolation, but very few survive contact with the rest of the company.
In the last few years, this has become one of the most common patterns we see with companies exploring AI automation. The main problem that they face is everything around the model in production: the workflow, data, integrations, permissions, monitoring, fallback logic, and human review.
If you sign off on AI investment as a CTO, VP of Engineering, or founder, the decision in front of you is which workflows are mature enough to produce measurable value once the prototype meets the rest of the company, and which workflows are better left alone until the underlying data and process are ready.
This article gives you a framework for making that call before the budget is committed. It explains what ROI from AI automation means in a production environment, which costs most calculations leave out, how to evaluate a candidate workflow in four stages, and when the right answer is to wait.
What ROI From AI Automation Actually Means
AI automation ROI measures whether an AI-enabled workflow creates more measurable business value than it costs to build, deploy, operate, govern, and maintain. The formula itself is not the problem.
(Total Benefits − Total Costs) / Total Costs × 100
What makes ROI hard to measure in AI work is deciding what counts as a benefit and what counts as a cost once the system is running in production.
The numbers move as pilots scale, and most CTOs have seen this. Enterprises reporting AI ROI of around 31% during the 2023 pilot wave watched returns settle near 7% at scale, below the 10% cost-of-capital threshold most firms use as a capex hurdle rate. That gap traces back to costing and reflects what the original business case counted and what it left out.
Standard ROI calculations split benefits into two categories.
- Hard ROI is the measurable kind: labor cost avoidance, lower cost per ticket or transaction, throughput gains that translate into headcount you no longer need to add.
- Soft ROI covers the rest: faster decisions, improved customer experience, reduced operational risk, and better employee experience. Both belong in a business case. Only one shows up on a P&L line, and the other is where most overstated AI ROI claims live.
But even a clean Hard ROI calculation can be wrong by a wide margin. Automate a reporting workflow that consumes around ten hours a week from each of eight analysts, and the first-year ROI on paper can reach the mid-40s as a percentage. That number holds only if the recovered hours go into work the business needs done. If those hours go into validating AI output, reconciling mismatched figures, or rebuilding reports the system got wrong, the ROI collapses, and the workflow has paid for two versions of the same task.
This means ROI from AI automation behaves more like a system-design metric than a financial one. Whether the number on the slide ends up at 7% or 31% depends less on the model than on how the system around it routes work and reabsorbs recovered time.
The Hidden Costs Most AI ROI Calculations Forget
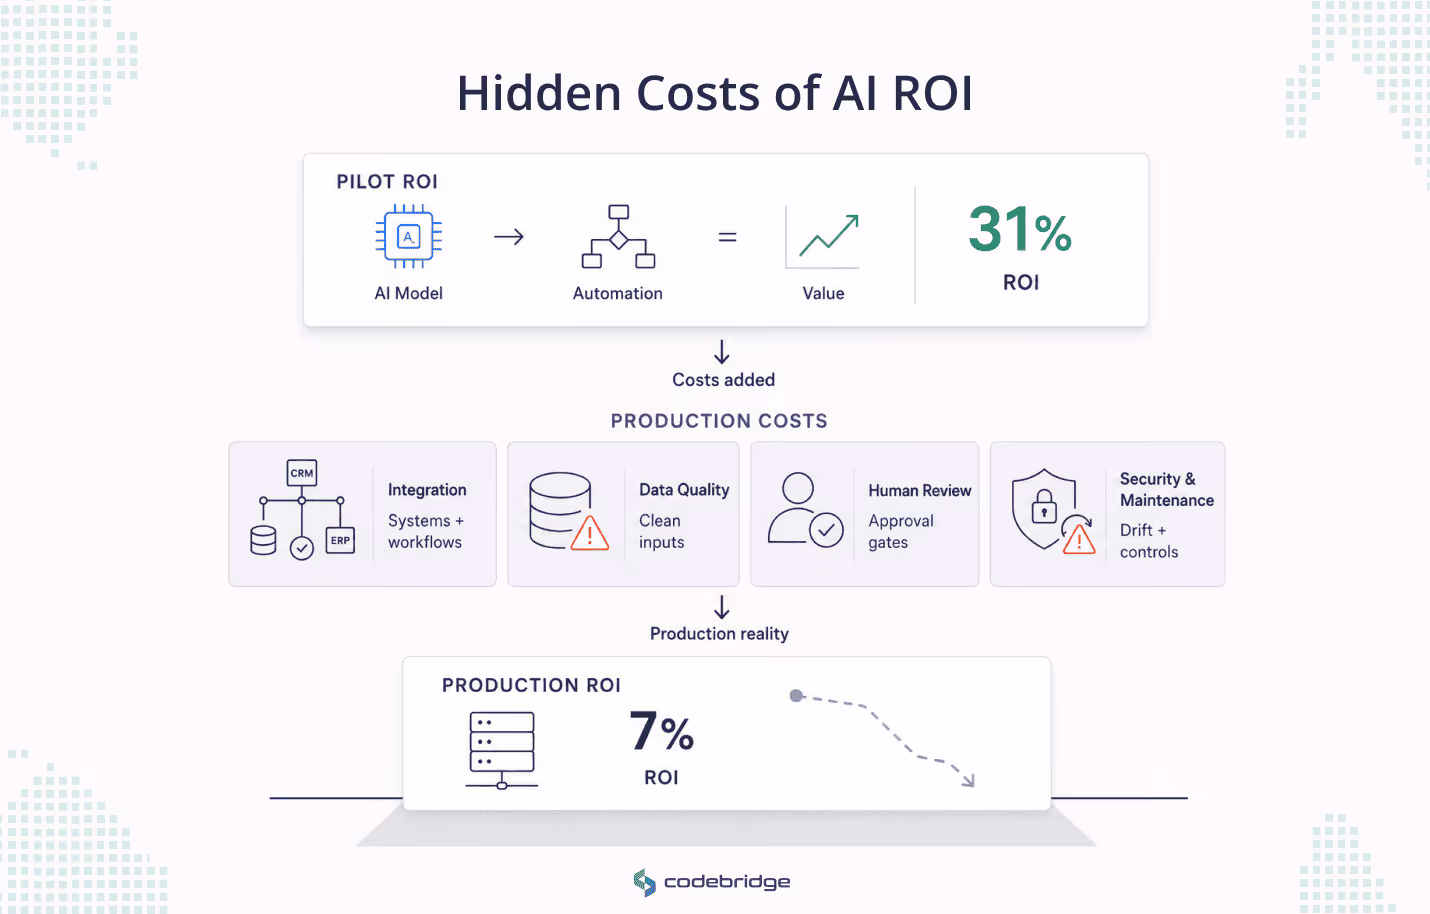
The cost side of AI ROI is the real production environment. Demos make it look cheap but real workflows expose what demos can skip, such as integration paths, human review, security, compliance, and the ongoing maintenance load of a system that drifts even when no one touches it.
At Codebridge, we usually see hidden costs as an early warning sign. If they are missing from the business case, the project already looks healthier than it really is. Research on AI portfolio outcomes supports this. Organizations that include technical debt in their AI business cases project 29% higher ROI than those that do not. And the model may be identical, but the difference is whether the budget reflects production reality or only the demo.
Four cost buckets account for most of the gap between pilot and production economics.
1. Integration and architecture
An AI workflow has value only when it connects to the systems that already run the business: CRMs, ERPs, ticketing systems, document stores, and internal knowledge bases.
The cost demos hide is the engineering work that makes those connections reliable for a non-deterministic component. Data pipelines need contracts that the model can be held to. Outputs need validation gates. Failures need fallback paths. A serious AI delivery is an architecture exercise first and a prompt exercise second.
2. Data preparation and quality
Most teams underestimate the cost of getting their data ready for AI work. Only 26% of Chief Data Officers say their data capabilities can support new AI revenue streams. The gap matters more for agents than for humans.
A human analyst reading a messy report notices the noise and works around it. An AI agent reading the same data scales the error. It normalizes the bad row, propagates it downstream, and gives every consumer of the workflow a wrong answer that no one can trace back to the source.
3. Human-in-the-loop and review
Some workflows should not be automated end-to-end, and the cost of keeping a human in the loop has to sit in the ROI from day one. Clinical coordination, legal review, sensitive HR decisions, financial approvals, and most regulated work belong to this category.
The cost goes beyond the reviewer's time. It also covers the design work of building a workflow that makes review fast, traceable, and worth doing. The alternative is a system where employees rubber-stamp AI output because the review interface is harder to use than the AI is to trust.
4. Security, compliance, and maintenance
AI systems carry a maintenance load that traditional software does not. Concept drift and data drift change the model's behavior even when the code does not change, and monitoring for both is an ongoing engineering cost.
Security adds another category of risk specific to LLMs: prompt injection, excessive agent permissions, retrieval poisoning.
Compliance is now a direct line item. Under the EU AI Act, penalty exposure for non-compliance reaches up to 7% of global annual turnover.
Taken together, these four buckets explain why the same workflow can show a 31% pilot ROI and a 7% portfolio ROI. Because the pilot ignored most of them, but the production system cannot.
A Practical Framework for Measuring ROI From AI Automation
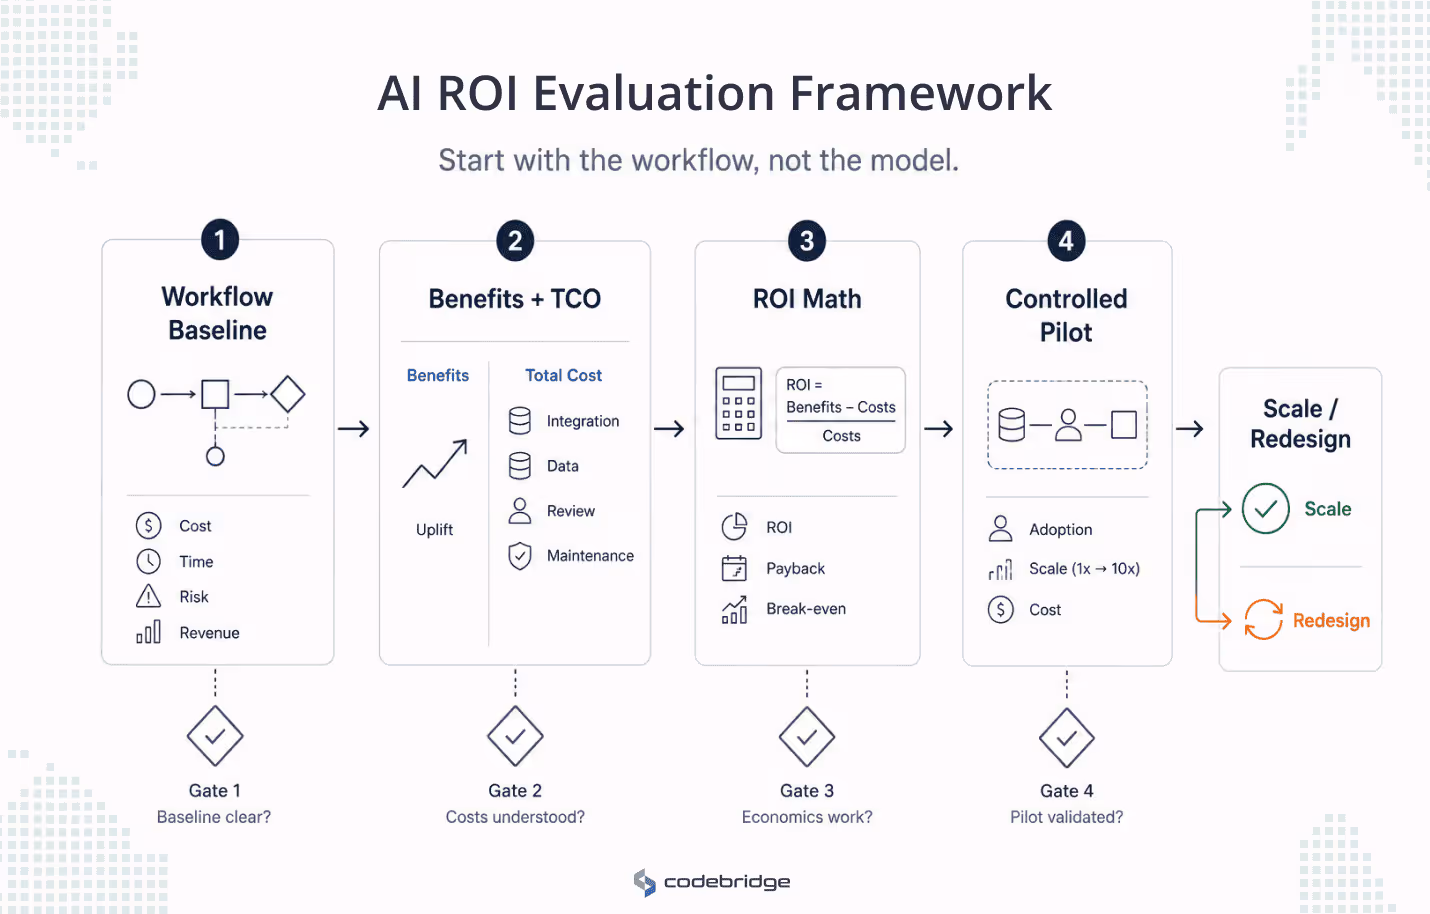
If those costs are what most calculations miss, the next question is how to evaluate a candidate workflow against them before signing off on the budget. The framework below moves through four stages. Each stage ends with the questions you have to answer before the workflow advances to the next stage.
The framework assumes you start with a workflow, not with a model. "Where can we add AI?" is the wrong starting question. Gartner notes that proof-of-concept abandonment is driven by poor data quality and unclear business value more than by model limitations.
Most failed AI projects fail at Stage 1 of the framework below, which is why the framework spends more time there than the eventual budget allocation suggests it should.
Stage 1: Define the workflow and its baseline
Identify a workflow that meets three conditions:
- It is repetitive enough to benefit from automation
- Expensive or risk-laden enough to justify the investment
- Well-understood enough that you can describe its inputs, outputs, decision points, and exceptions on a single page.
Typical candidates include manual reporting, sales research, medical workflow coordination, invoice triage, support ticket routing, or lead qualification.
Workflows full of exceptions or undocumented institutional knowledge belong on a different list, which Section 5 covers.
Once you have the workflow, measure the current state against four categories of metrics. These are the same categories you will use to project the benefit in Stage 2:
- Cost and throughput: hours spent, cost per transaction, work completed per person per unit of time.
- Cycle time: elapsed time from request to resolution, from raw data to decision-ready output.
- Quality and risk: error rates, rework volume, compliance findings, audit traceability, dependency on individuals or fragile spreadsheets.
- Revenue impact (where relevant): conversion rates, response times, churn signals.
The NIST AI Risk Management Framework treats quality and risk metrics as core to value, not as a separate compliance layer. Because risk control determines whether productivity gains survive long enough to compound.
Gates before Stage 2:
- Is the baseline grounded in measured data rather than estimates?
- Is the workflow painful enough today to justify the investment of building, deploying, and maintaining an AI system around it?
If either answer is unclear, the workflow is not ready for the next stage.
Stage 2: Model the benefits and the total cost
Project the benefit against the same four metric categories. Use measured uplift from controlled experiments rather than vendor projections, and prefer ranges over point estimates. A "30% to 45% reduction in cycle time, contingent on data quality holding above current baseline" is more useful than "40% reduction."
Then build the total cost of ownership across the full lifecycle. Most TCO calculations underestimate maintenance. Budget 15% to 25% of the initial development cost annually for model maintenance, monitoring, retraining, and drift response. Add the cost categories from
Section 3: integration engineering, data preparation, human-in-the-loop review, security and compliance overhead.
Gates before Stage 3:
- Is the data clean, accessible, and governed by clear permissions that the AI workflow can respect?
- Are the integration paths, fallback logic, and output validation mechanisms understood, or are they still in "we'll figure it out during development"?
These two gates account for most of the variance between pilot ROI and portfolio ROI. Stage 3 is arithmetic.
Stage 3: Calculate ROI, payback, and break-even
This stage is where the numbers from Stages 1 and 2 meet three formulas:
- ROI = (Benefits − Costs) / Costs × 100
- Payback Period = Total Project Cost / Monthly Net Benefit
- Break-even Volume = Fixed Costs / Benefit per Automated Task
Two of these outputs matter more than the headline ROI percentage.
The payback period tells you how quickly the workflow recovers its development costs. Most enterprise AI investments take two to four years to pay back at the portfolio level. A pilot that promises payback in six months is either targeting an exceptional workflow or hiding cost categories that production will surface.
The break-even volume tells you whether the workflow has enough scale to justify automating in the first place. A workflow that runs 40 times a month and saves 15 minutes per run does not, regardless of how clean the data is.
Gate before Stage 4:
- Does the workflow have enough volume that the recurring cost of running the AI system pays for itself within a window the business can underwrite?
Stage 4: Validate in a controlled pilot
The pilot's job is not to prove that the model works, as the model already worked in the prototype. Now its job is to test the three things prototypes hide:
- Integration complexity at production scale
- Real cost per inference at production volume
- User adoption when the system is no longer running in demo mode
A controlled pilot has a defined scope, defined success metrics drawn from the same four categories, and a defined exit condition. McKinsey's research finds that well-defined KPIs at the pilot stage correlate more strongly with eventual EBIT impact than any other variable they tracked.
Final gates before scaling:
- Why will the team trust this system enough to use it instead of working around it?
- How do costs behave at 10x the current usage, and does the business case hold under that scaling?
If the pilot answers both, the workflow is ready to scale. If it does not, the right move is to redesign the workflow rather than push it into production.
When AI Automation Is Not Worth the Investment
Some workflows do not belong in the framework at all. And it is important for businesses to Identify them early. It matters more than improving the AI itself, because automating a broken workflow does not fix it. It produces a faster version of the broken behavior.
Four patterns describe most of the workflows that should not be automated, regardless of how capable the model gets.
1. The workflow does not run often enough to matter.
Automation makes sense when volume amplifies a small per-unit gain into meaningful aggregate value. A workflow that runs forty times a month and saves a few minutes per run cannot earn back the engineering, monitoring, and maintenance load required to support it. The cost of keeping the AI system alive exceeds the value it produces.
2. The process is not understood, or is mostly an exception.
A workflow that you cannot describe on a single page is a workflow you cannot automate. Most "exception-heavy" processes are not exception-heavy by accident. They encode tacit decisions someone in the business is making, case by case, and capturing those decisions in a model is a research problem rather than a delivery problem. Pretending otherwise produces an AI that handles 60% of cases right and 40% of cases wrong, with no clear way to tell which is which.
3. The data does not support it, or the risk does not allow review-free deployment.
Two failure modes sit in this bucket. Either the data is not clean, accessible, or governed well enough for an AI agent to act on it without amplifying errors, or the workflow handles decisions where a wrong answer carries enough downside that a human must review every output.
4. The reason for automating is "we should be using AI."
A workflow that the business is automating to keep up with competitors, to satisfy a board mandate, or to signal innovation is being automated for someone other than the people who use it.
These projects collect requirements from the people who want the announcement and ignore the people who have to live with the result. The model ships. The workflow does not improve.
A workflow that fails any of these tests is not a worse candidate for automation. It is the wrong candidate. The right next move is to redesign the underlying process, fix the data layer, or accept that the workflow is already doing what it should and leave it alone.
How Codebridge Thinks About ROI From AI Automation
The framework above captures the core of how Codebridge evaluates a workflow. The working version has picked up adjustments from production engagements that do not fit neatly into four stages, but the discipline holds: define the workflow, baseline against measurable categories, model the full production cost, validate in a pilot that tests the system around the model rather than the model in isolation.
Two recent engagements show what this looks like in practice.
RadFlow AI: production AI inside a regulated workflow
A Tier-1 diagnostic imaging network running 12 centers had scan volumes growing 22% a year against flat radiologist headcount. The network had already piloted multiple commercial AI tools.
Each failed the same way. The AI lived in a separate interface from the PACS viewer, produced around 4.1 false positives per scan, and trained radiologists to dismiss its findings. The model worked. The architecture around it produced negative operational value.
Codebridge embedded the AI inside the diagnostic workspace, added an active learning loop that retrained the false-positive reduction network from radiologist overrides, and built a Clinical AI Oversight Module that kept agreement rates, override rates, and model versions visible to the governance team.
Measured after 9 months in production:
- CT reading time fell from 15.2 to 9.4 minutes per study (38% reduction, validated across 4,800+ cases)
- false positives fell from 4.1 to 0.4 per scan
- The Radiologist Trust Score rose from 27% to 89%
- Estimated annual productivity impact: $2.1M
The headline is the 38% reduction, but the Trust Score is the more important number. Trust recovery was the failure mode that prior vendors could not engineer their way out of. The framework flagged it at Stage 1 (audit traceability) and Stage 4 (will the team trust the system). Codebridge solved it at the architecture level.
Final Takeaway: ROI From AI Automation Is Measured in Numbers, but Won or Lost in the Workflow
ROI from AI automation is a property of the workflow you build around the model. It includes how the data gets in, where humans stay in control, how errors get caught, and what the system costs to keep running once the novelty wears off.
A spreadsheet will not tell you whether the data is clean, whether the integrations are realistic, or whether the team will use the system instead of working around it. The CTO's job in the AI investment cycle is to ask the questions a spreadsheet cannot answer.
The next time someone pitches you an AI workflow, ask one question before anything else: What is the baseline metric you are trying to move, and how was it measured? If the answer is unclear, you are at Stage 1, regardless of how good the demo looked. Most failed AI projects fail at Stage 1.
If the framework above does anything useful, it is to make the bad investments visible before the budget is committed, and to make the good investments survive the gap between pilot and production. The numbers will get reported either way. What determines whether they hold is the design of the workflow underneath them.


Heading 1
Heading 2
Heading 3
Heading 4
Heading 5
Heading 6
Lorem ipsum dolor sit amet, consectetur adipiscing elit, sed do eiusmod tempor incididunt ut labore et dolore magna aliqua. Ut enim ad minim veniam, quis nostrud exercitation ullamco laboris nisi ut aliquip ex ea commodo consequat. Duis aute irure dolor in reprehenderit in voluptate velit esse cillum dolore eu fugiat nulla pariatur.
Block quote
Ordered list
- Item 1
- Item 2
- Item 3
Unordered list
- Item A
- Item B
- Item C
Bold text
Emphasis
Superscript
Subscript