


Last June, an instructional designer hit a breaking point. Articulate Storyline had raised prices again, AI features came as a paid add-on instead of built-in, and mobile responsiveness remained an afterthought. The tool that once defined their workflow had become a budget drain. So they did what budget-constrained teams rarely have time to do: they explored alternatives. Within weeks, they'd built their first client project on Parta.io, a platform most of their peers had never heard of.
This story plays out constantly in EdTech development. Teams with limited external budgets don't fail because they lack resources. They fail because they optimize for the wrong constraints.
KEY TAKEAWAYS
Internal capability often beats external contracts, but teams default to "professional" outsourcing due to misplaced credibility concerns.
Tool costs compound silently, AI upsells, per-seat licensing, and feature fragmentation drain budgets before development even begins.
Post-ESSER EdTech requires efficacy proof, not feature impressiveness; companies surviving 2025-2026 solve teacher problems, not investor pitches.
Corporate e-learning (21.7% CAGR) outpaces consumer segments, B2B positioning may offer better budget use than B2C plays.
The Hidden Problem: Budget Leaks Before Development Starts
The global EdTech market hit $205 billion in 2026, representing 3.5% of total education spending and rivaling the entire video game industry. That scale suggests opportunity. But for teams operating with constrained external budgets, the market's growth masks a brutal reality: most development dollars disappear into overhead, not outcomes.
That adoption curve creates pressure. When learners expect AI-powered experiences, teams feel compelled to buy rather than build. Vendors know this. They've restructured pricing accordingly, core features become "enterprise tier," AI becomes an add-on, mobile responsiveness stays perpetually "coming soon." The result? Budget-constrained teams pay premium prices for partial solutions, then scramble to fill gaps with additional tools, contractors, or workarounds.
One Reddit user captured the frustration: "The price increases, selling AI as an add-on instead of a feature, lack of true responsiveness on mobile... set me off on a journey to see what else was out there." They found alternatives. Most teams don't look.
The Build-vs-Buy Illusion
Consider a pattern we've observed repeatedly: an educational research team with a 2-year project timeline debates whether to use WordPress with a LearnDash plugin or hire an external firm for custom LMS development. The team has an in-house developer capable of building custom plugins, REST APIs, and analytics dashboards. Yet the non-technical stakeholders push for the external firm because it seems "more professional and grows with you."
"Their strong preference for firm-developed LMSs has made me doubt myself..." I'm wary of long-term costs, vendor lock-in, and losing access to critical learner data.
u/[developer], Reddit r/Wordpress
This isn't a technical decision. It's a credibility performance. Teams with limited budgets often spend more to appear serious than to ship effectively. The external firm quote will include discovery phases, project management overhead, and change-order provisions that double the initial estimate. The WordPress solution ships in weeks. But "we built it on WordPress" sounds less impressive in grant reports than "we partnered with a specialized development firm."
The comparison below illustrates how these decisions typically play out across budget allocation:
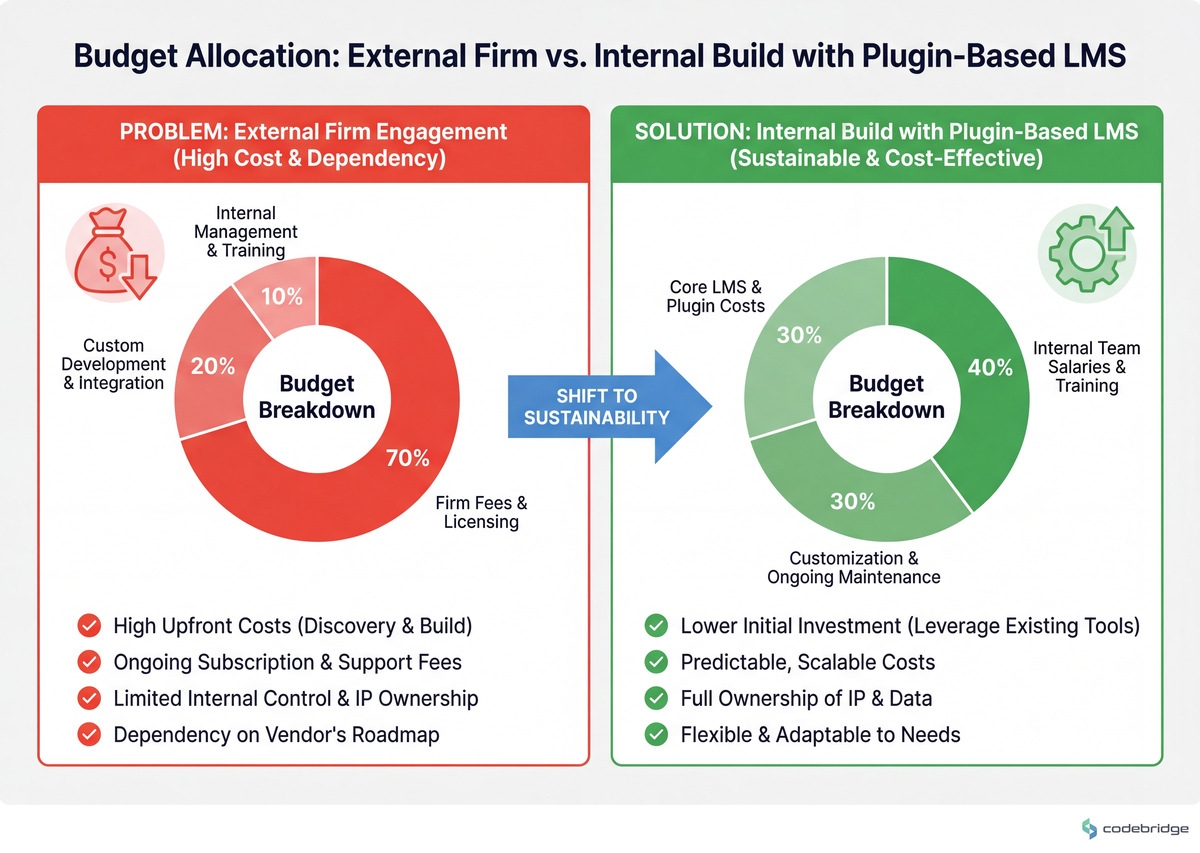
Notice that the external approach front-loads credibility at the expense of iteration speed. For research projects requiring rapid hypothesis testing, this trade-off often proves fatal.
Real Stories: Where Budget Optimization Actually Happens
The EdTech industry experienced what one observer called a "graveyard for giants" in 2025. 2U filed for bankruptcy. Paper faced a "usage scandal." The post-pandemic budget correction hit as ESSER funds expired, forcing efficacy audits the industry wasn't prepared for. The companies that survived weren't those with the biggest feature sets, they were those demonstrating actual learning outcomes.
The 1:1 device dream has become a logistical nightmare. Between breakage rates, the "login tax" of getting 30 kids online, and constant VPN battles, the ROI on ubiquity looks worse by the day.
This matters for budget-constrained teams because it reveals what actually drives purchasing decisions. Schools and institutions aren't buying transformation anymore. They're buying solutions to specific, measurable problems. A team building EdTech on a limited budget should optimize for demonstrable efficacy, not impressive dashboards.
Meanwhile, the instructional design job market tells its own story. Contract rates dropped from $50/hour to $25-35/hour for mid-level IDs with less than five years of experience. One hiring manager posted a job at $7.25/hour, and received applications. AI tools have commoditized production work. The value has shifted upstream: understanding people, solving business problems, designing behavior-changing experiences.
The Pattern: What Budget-Efficient Teams Do Differently
The K-12 EdTech segment commands 39.40% of revenue, the largest sector by far. But the fastest growth sits in corporate e-learning, expanding at 21.7% CAGR through 2030 within a $340 billion global corporate training market. Budget-constrained teams often chase the largest segment when the fastest-growing segment offers better use.
The process flow below shows how successful teams typically allocate limited budgets across the development lifecycle:
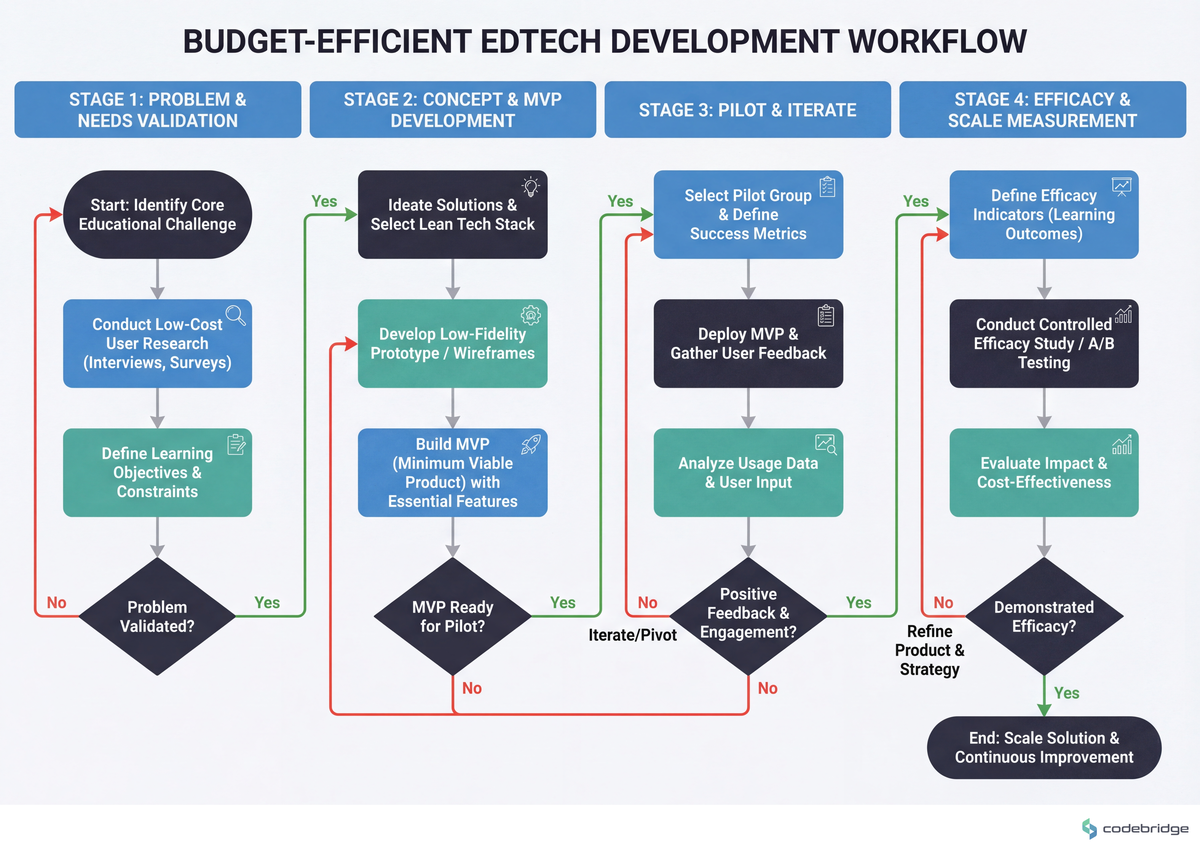
Teams that optimize effectively share three characteristics:
They validate tool costs against actual usage patterns. A $500/month authoring platform looks reasonable until you calculate cost-per-published-module. If your team ships four modules monthly, that's $125 per module in tooling alone, before content development, hosting, or analytics. The instructional designer who switched to Parta.io didn't just save money; they eliminated the cognitive overhead of justifying subscription costs to stakeholders.
They treat vendor lock-in as a budget line item. When an external firm builds your LMS, they own the architecture decisions. Migrating later requires rebuilding. That future cost rarely appears in initial budgets, but it constrains every subsequent decision. Teams with internal capability who build on open platforms (WordPress, Moodle, even well-documented SaaS APIs) preserve optionality.
They measure what learners actually do, not what dashboards display. One Reddit commenter asked the question most EdTech teams avoid: "Where's the focus on motivation? On building curiosity? On helping learners struggle productively instead of just gamifying everything?" The teams surviving the post-ESSER correction answer that question with data. They track completion rates, knowledge retention at 30/60/90 days, and behavioral change metrics, not just login frequency and time-on-platform.
Actionable Framework: Optimizing EdTech Development on Limited Budget
1. Audit Tool Costs Monthly, Not Annually
Most teams review software subscriptions during budget planning. By then, annual contracts have auto-renewed and switching costs have compounded. Set a monthly calendar reminder to review: Which tools did we actually use this month? Which features justify their tier? What would we lose by downgrading?
The instructional designer who found Parta.io started this process because Storyline's AI add-on pricing forced the question. Don't wait for vendors to force it.
2. Quantify the "Professionalism Premium"
When stakeholders push for external development because it seems more credible, ask: what would we spend the difference on if we built internally? A 2-year research project might see a $50,000 gap between WordPress/LearnDash and custom firm development. That $50,000 could fund user research, efficacy studies, or iteration cycles that actually improve learning outcomes.
The strategic positioning of this decision is illustrated below:
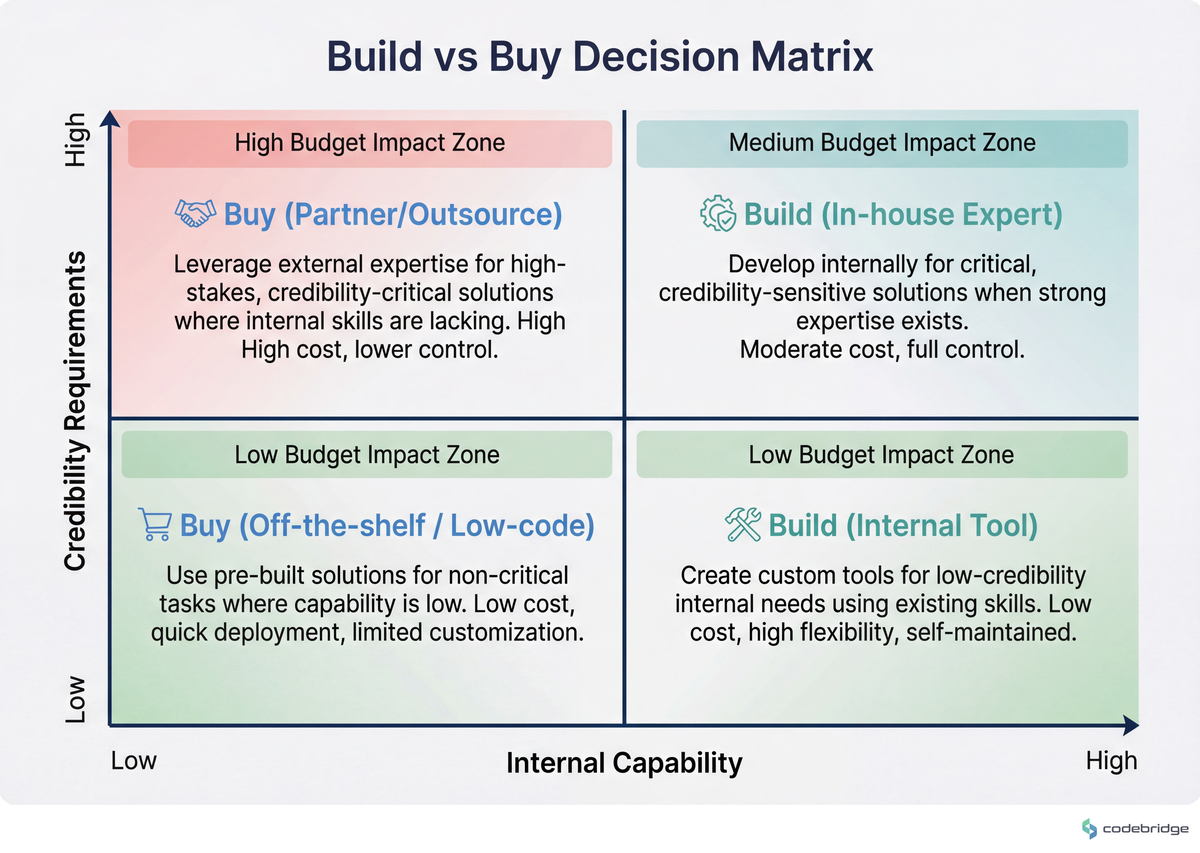
3. Position for Corporate, Not Consumer
Consumer EdTech faces margin pressure as AI commoditizes content delivery. Corporate e-learning buyers have larger budgets and clearer ROI requirements. If your team can demonstrate workforce skill development, compliance training efficiency, or onboarding time reduction, you're competing in a segment growing at 21.7% annually, not fighting for attention in a crowded consumer market.
4. Build Efficacy Measurement Into MVP
The EdTech companies that collapsed in 2025 had impressive dashboards and weak outcome data. Budget-constrained teams can't afford that gap. Before building features, define: What behavior change indicates success? How will we measure it? What baseline do we need before launch?
This isn't additional work, it's prioritization. Features without efficacy measurement are features you can't justify in the next budget cycle.
5. Treat Geographic Expansion as Budget Arbitrage
India's EdTech market grows at 19-29% annually, making it the second-largest e-learning market globally. North America's share will decline from 38% to 30% by 2036 as Asia-Pacific rises to 35%. Teams with limited budgets can access development talent, user research participants, and pilot markets in emerging regions at lower cost than domestic equivalents.
| Region | 2024 Share | 2036 Projected Share | Growth Rate |
|---|---|---|---|
| North America | 35.62% | ~30% | Moderate |
| Asia-Pacific | ~28% | 35% | 19-29% (India) |
| Europe | ~22% | ~20% | Moderate |
| Rest of World | ~14% | ~15% | Variable |
The Uncomfortable Truth About "Limited Budget"
Most teams describing their budget as "limited" actually have sufficient resources for effective EdTech development. What they lack is permission to allocate those resources differently. The external firm feels safer than the internal build. The enterprise tool feels more defensible than the open-source alternative. The feature-rich platform feels more serious than the focused solution.
The instructional designer who switched tools last June didn't have a bigger budget than their peers. They had clearer criteria: mobile responsiveness, AI as feature not add-on, sustainable pricing. When their existing tool failed those criteria, they moved. Most teams never define criteria that specific. They optimize for vague "professionalism" and wonder why budgets feel perpetually insufficient.
Where This Leads
By 2030, the EdTech market will approach $395 billion, roughly doubling from today. AI integration will shift from differentiator to table stakes. The competitive advantage will move to implementation quality and learning outcome measurement. Teams optimizing budgets for feature parity will find themselves perpetually behind. Teams optimizing for efficacy proof will find themselves perpetually fundable.
The instructional designer who explored alternatives last June didn't just save money. They built a workflow that produces measurable outcomes on sustainable economics. Their next budget conversation will center on results, not tool costs. That's the real optimization.
Diagnostic Checklist: Signs Your EdTech Budget Is Leaking
Your authoring tool costs more than $100 per published module when you calculate actual output
AI features in your stack are add-ons or "enterprise tier" rather than built into base pricing
You have internal development capability but default to external contractors for "credibility"
Your learning analytics measure engagement (logins, time-on-platform) but not outcomes (retention, behavior change)
Mobile responsiveness is on your roadmap rather than in your current release
You've never calculated the cost of migrating away from your current LMS vendor
Your budget conversations focus on features rather than efficacy metrics
You're building for consumer markets while corporate e-learning grows at 21.7% CAGR
Your tool subscriptions auto-renew annually without monthly usage review
Not sure where your EdTech budget is actually going?
Request a development efficiency audit to identify optimization opportunities specific to your team's constraints.
REFERENCES


Heading 1
Heading 2
Heading 3
Heading 4
Heading 5
Heading 6
Lorem ipsum dolor sit amet, consectetur adipiscing elit, sed do eiusmod tempor incididunt ut labore et dolore magna aliqua. Ut enim ad minim veniam, quis nostrud exercitation ullamco laboris nisi ut aliquip ex ea commodo consequat. Duis aute irure dolor in reprehenderit in voluptate velit esse cillum dolore eu fugiat nulla pariatur.
Block quote
Ordered list
- Item 1
- Item 2
- Item 3
Unordered list
- Item A
- Item B
- Item C
Bold text
Emphasis
Superscript
Subscript