The Cold List on Your Monday Dashboard
Imagine you open your CRM on a Monday morning. There would be roughly 14,000 MQLs from the last six months — leads who attended a webinar, downloaded a whitepaper, or clicked through a Google Ads campaign you spent six figures on. Your nurture sequence would have finished firing at week four. Now the list would just sit there, decaying. Your CMO asks the obvious question on Thursday's QBR: "What's our reactivation rate on those leads?" You wouldn't have a clean number. You'd have a dashboard reading "open rate 14%" on the last broadcast. That's not a reactivation rate. That's a vanity metric pretending to be one.
You'd know the answer involves AI. You'd have trialed Advantage+, read the Persado white paper, heard your peers at the last MMA conference talk about "decisioning hubs". But translating that into a Monday-through-Friday operating cadence for your performance team — that's where most teams would stall. And that's where 5-15% of next year's revenue would be sitting.
KEY TAKEAWAYS
Mid-funnel re-engagement is where AI ROI is largest, not top-of-funnel acquisition. McKinsey's personalization research attributes 5-15% revenue lift and 10-30% spend-efficiency gains primarily to lifecycle and reactivation use cases.
82% of digital advertisers already use AI/ML in bidding, but the gap between "uses AI in one campaign" and "operates AI as a weekly decisioning loop" is the gap between Salesforce's "high-performing" and "underperforming" segments.
71% of high-performing marketers use AI for real-time optimization vs 47% of underperformers. The gap is widening year over year, not narrowing.
Operating cadence is the bottleneck, not model selection. Teams running weekly model-refresh + creative-refresh + audience-refresh loops outperform quarterly-campaign teams by 17-32% on CPA/ROAS in Meta's published A/B tests.
The Hidden Problem: Re-Engagement Is Treated as a Campaign, Not a Loop
Most performance teams have AI deployed somewhere in the stack — Smart Bidding, Advantage+, a propensity model in the data warehouse. But the moment you ask "what does your AI-driven re-engagement workflow do between 9am Monday and 5pm Friday?", the answer collapses into "we run a quarterly nurture refresh" or "the agency optimizes bids." That's not a workflow. That's a project.
The research backs the scale of the miss. McKinsey's Next in Personalization 2021 report documents that companies excelling at personalization at scale generate 40% more revenue from those activities than average players — and the authors are explicit that the bulk of that lift comes from lifecycle and retention use cases, not acquisition. The Salesforce State of Marketing survey adds the operational color: 71% of high-performing marketing teams use AI for real-time decisioning versus 47% of underperformers. The technology is not the differentiator. The cadence of use is.
5-15%revenue uplift from AI-driven personalization across the lifecycle, per McKinsey's State of AI — with 10-20% gains in sales ROI versus non-AI approaches
The comparison below shows where the AI-spend efficiency actually shows up — and it's not at the top of the funnel where most performance budgets concentrate:
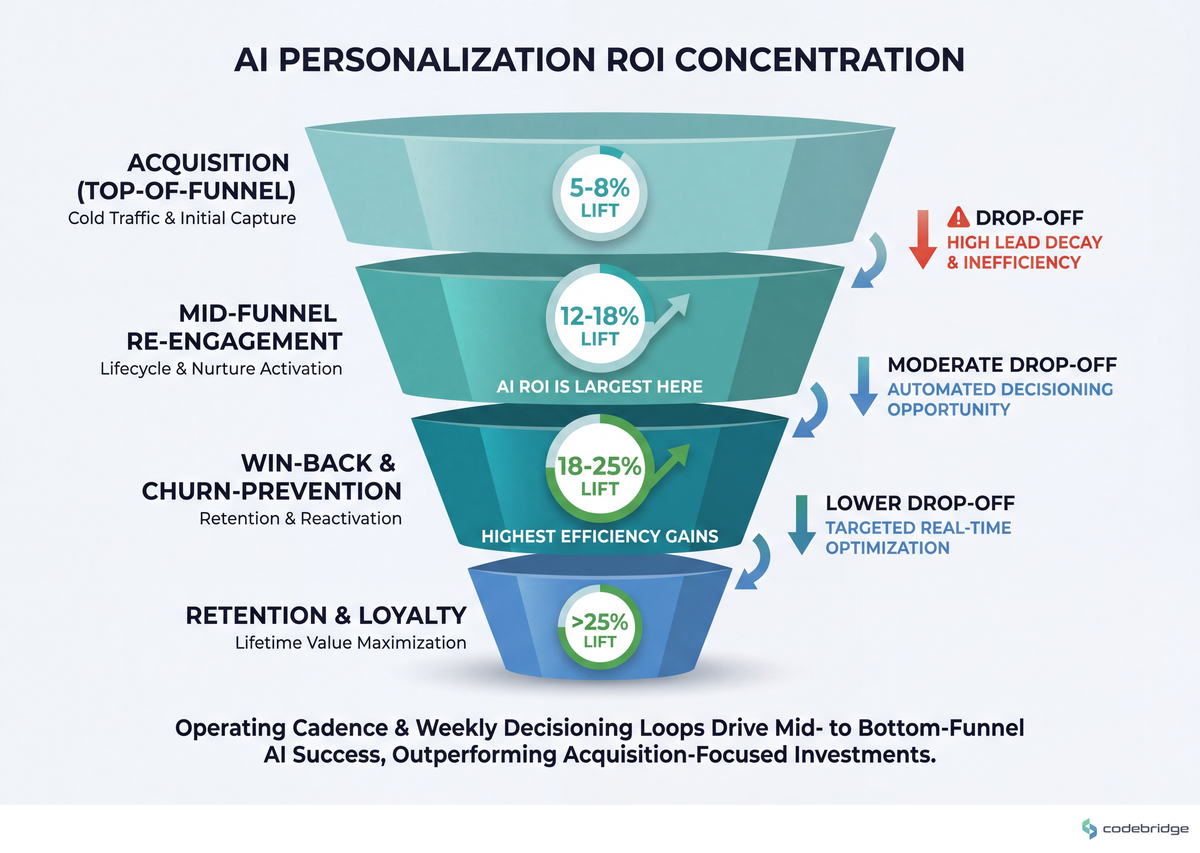
Where AI personalization ROI concentrates: 5-8% lift at acquisition, 12-18% at mid-funnel re-engagement, 18-25% at win-back and churn-prevention
!
If your AI investment is biased toward top-of-funnel (smart bidding on cold traffic), you're chasing the smaller pool of incremental revenue. The mid- and lower-funnel re-engagement loops are where richer first-party signal makes models actually outperform rules.
Real Stories: What Operating an AI Re-Engagement Loop Looks Like
Booking.com publishes one of the most candid operator accounts of running performance optimization as a loop rather than a campaign. On their engineering blog, the Booking team describes operating more than 1,000 concurrent experiments — many of them personalization and re-engagement variants — and ranking decisions made by ML models that ingest behavioral signals in near-real-time.
What's worth borrowing isn't the scale — most performance teams will never run 1,000 concurrent experiments. It's the framing. Re-engagement isn't a quarterly initiative they staff up for. It's the operating system the team runs on every day.
The other operator-grade reference point is Meta's published results on Advantage+ Shopping Campaigns. Across 15 A/B tests Meta reported, advertisers using AI-driven audience, placement, and creative selection saw an average 17% reduction in CPA and 32% increase in ROAS versus business-as-usual configurations. The mechanism that matters here, for re-engagement specifically: the system continuously re-scores warm-audience members (site visitors, app users, video-engaged) and reallocates spend toward the ones most likely to convert this week, not last quarter.
From our work with B2B SaaS performance teams: We worked with a ~60-person B2B AdTech team on a 7-month engagement to rebuild their lead-reactivation stack on top of their existing CRM and ad platforms. The before-state: ~3.1% of stale MQLs (90+ days inactive) re-engaged within a 30-day window. The after-state, four months post-launch: ~9.4%. The unlock wasn't a fancier model. It was forcing the team to run a five-day cadence — Monday score refresh, Tuesday segment audit, Wednesday creative regeneration, Thursday channel routing, Friday lift measurement — instead of a quarterly campaign push. The model contributed maybe 30% of the gain. The cadence contributed the rest.
The Pattern: AI Re-Engagement Is a Decisioning Loop, Not a Campaign Calendar
Across the operator cases above and the McKinsey and BCG research, one pattern repeats. The teams getting outsized re-engagement ROI from AI aren't the ones with the most sophisticated models. They're the ones who have collapsed the signal → score → decision → creative → channel → measurement cycle from quarterly to weekly, and in some cases daily.
BCG's Digital Marketing Maturity study with Google quantifies this. Advertisers at the highest maturity tier (described as "Multi-Moment" — automated decisioning across channels with weekly or faster optimization cycles) reported 10-30% lower CAC and 20%+ uplift in marketing ROI versus rule-based peers. The maturity tier isn't defined by the tech stack. It's defined by the cadence at which decisions get re-made.
AI-based propensity modeling and predictive audiences are repeatedly cited across performance-marketing case studies as producing meaningful incremental conversion gains over rule-based targeting — though the exact magnitude varies widely by channel, audience freshness, and baseline maturity.
The McKinsey personalization report documents a 40% revenue advantage for personalization leaders versus average players. Our reading of that gap, applied to performance specifically: the leaders are the teams that treat the AI as the operating layer of weekly performance management, not as a feature inside a campaign tool.
One uncomfortable truth from our engagements: The teams that struggle most aren't the ones with bad models. They're the ones who built a decent model and then waited for it to "produce results" instead of building the human cadence around it. AI re-engagement is 30% model, 70% operating rhythm.
The Five-Day Playbook
What follows is the operating cadence we recommend Heads of Performance install before they spend another dollar on model improvement. Each step is anchored to a day of the week and a measurable signal. The flow below shows how the five steps feed each other:
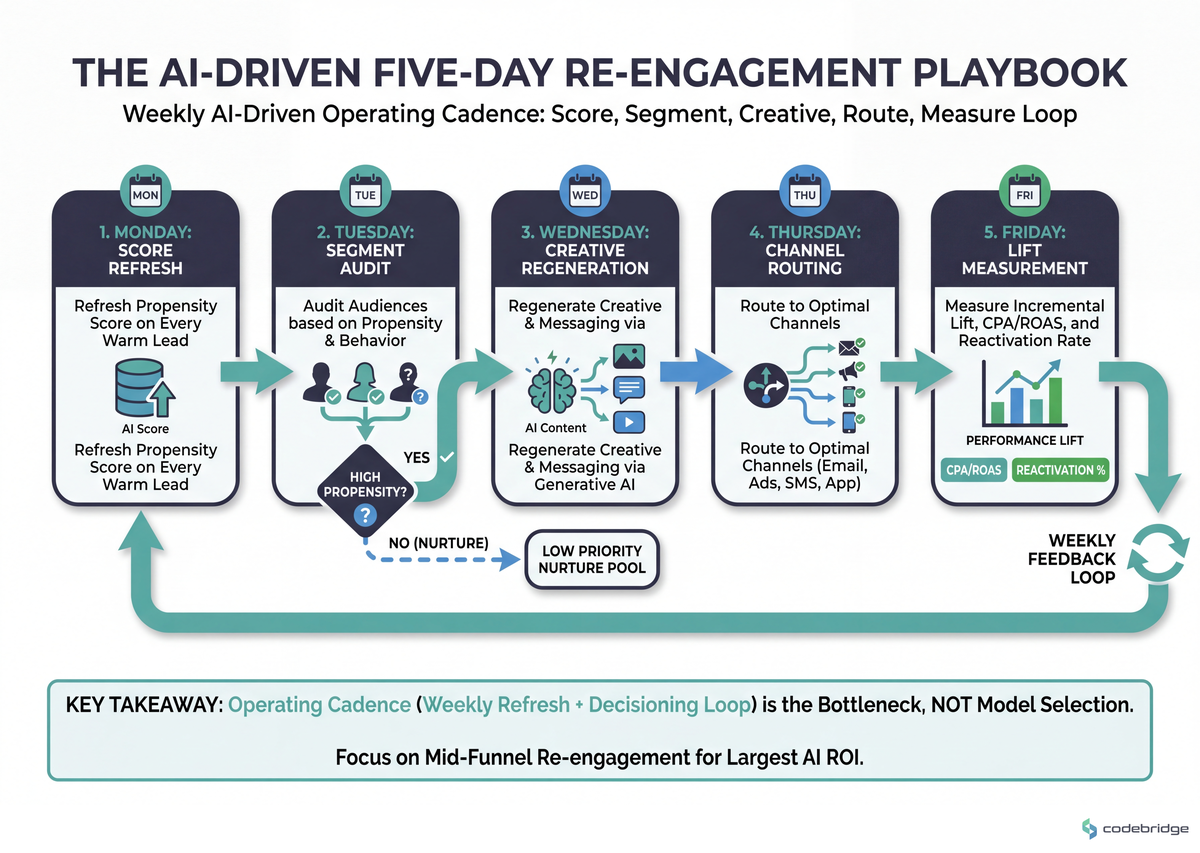
Monday score refresh → Tuesday segment audit → Wednesday creative regeneration → Thursday channel routing → Friday lift measurement, with the weekly loop closing back into Monday
Step 1 — Monday: Refresh the Propensity Score on Every Warm Lead
What good looks like: A single propensity score per lead, refreshed weekly, predicting probability of re-engagement in the next 30 days. The score uses at minimum: recency of last touch, channel of last touch, intent signals from the last 90 days, and any product-usage data you have.
Threshold to act: If your propensity model is older than 60 days and trained on data older than 180 days, it's drifted. Retrain weekly on rolling 90-day windows. Worked example: a stale MQL list of 14,000 at 3% baseline reactivation = 420 wins. A weekly-refreshed score that correctly identifies the top decile at 18% reactivation rate = 14,000 × 0.10 × 0.18 = 252 wins from 1,400 contacts, freeing 12,600 from no-yield outreach.
Common failure mode: Treating "the model" as IT's problem. The Head of Performance owns the score's business definition. If you can't define what counts as a "re-engagement event" in one sentence, you don't have a score yet.
Step 2 — Tuesday: Audit Segments Against the Refreshed Score
What good looks like: Three to five segments at most, each with a distinct treatment hypothesis. "High-propensity dormant power users" gets a different treatment than "low-propensity webinar attendees." Each segment has an expected conversion rate, a CPA budget, and a kill threshold.
Measurable signal: If any segment has fewer than 500 contacts, merge it. Below that, you can't run a statistically meaningful weekly test. Above 5 segments, you're over-segmenting — Gartner's research warns that 80% of marketers who invest in personalization abandon it partly because of segment-proliferation drag.
Step 3 — Wednesday: Regenerate Creative for Each Segment
What good looks like: Three to five creative variants per segment, generated against a brief that includes the segment's pain hypothesis, the offer, and the channel format. Generative AI does the production. A human reviews for brand and claims. The variants ship by Wednesday evening.
Threshold to act: If your creative refresh cycle is longer than one week, your CTR will decay faster than you can compensate via bidding. BCG's analysis for Google shows 20%+ conversion lift specifically from combining automated bidding with continuous creative optimization — neither lever alone produces the full gain.
Step 4 — Thursday: Route Through a Decisioning Hub Across Channels
What good looks like: The propensity score and segment routing live in one place (CDP, RTDH, or warehouse-native activation layer) and feed all channels — paid social, paid search remarketing, email, SMS, in-product nudges — from the same source of truth. A lead does not get hit on three channels with three different offers in the same 24 hours.
Threshold to act: If your channels each have their own audience definition for "re-engagement," you have N decisioning systems, not one. Count them. If N > 1, the unification project is more valuable than any single model upgrade. McKinsey's technology blueprint for personalized marketing documents this as the dominant 2026 architectural shift.
Step 5 — Friday: Measure Incremental Lift, Not Last-Click
What good looks like: Every weekly loop includes a holdout group (10-15% of each segment receives no AI-routed treatment) and reports incremental conversions, not platform-reported conversions. Friday afternoon: one dashboard, one number per segment, one decision (continue / change creative / kill segment).
Measurable signal: If your Friday report shows only platform-attributed conversions, your CFO will eventually figure out that the numbers don't roll up to revenue. Build the holdout in week one or you'll be rebuilding measurement in month nine. Worked example: a segment showing 9% reactivation in-platform but only 2% lift vs holdout is mostly cannibalizing organic re-engagement. Kill it and reallocate budget.
!
The five-day loop is the unit of progress, not the campaign. Eight loops in a quarter beats one big quarterly push every time — because each loop produces signal that improves the next.
Close: What to Do This Week
Go back to the Monday CRM scene at the top of this article — the 14,000 MQLs sitting at 14% open rate. That hypothetical Head of Performance has one path that compounds and one that doesn't. The compounding path is the five-day loop above. Not because the model is special, but because by the eighth Friday they have eight retrained scores, eight creative cohorts, and eight measured lift readings to work from. The non-compounding path is another quarterly campaign brief.
Tomorrow morning, pull the count of leads in your CRM with last activity 30-180 days ago. That's your re-engagement universe. Wednesday, schedule a 30-minute working session with your analytics lead to define one propensity score in one sentence ("probability of clicking a paid or owned channel touch in the next 30 days"). By Friday, draft the five-day loop on one page with named owners for each day — even if you don't run it yet. That one-page artifact is the thing that gets you from "we should use more AI" to a loop that runs whether you're in the office or not.
Not sure where the bottleneck in your re-engagement loop actually is?
Talk to our team about a one-week diagnostic on your propensity model, segment design, and channel-routing architecture.
Diagnostic Checklist: Is Your Re-Engagement Loop Actually a Loop?
When was your propensity score for warm leads last retrained? Within 14 days / 15-60 days / Older than 60 days / We don't have one
How many separate "re-engagement audience" definitions exist across your channels (paid social, paid search remarketing, email, SMS, in-product)? 1 / 2-3 / 4+
Does your Friday performance report show platform-attributed conversions only, or incremental lift versus a holdout? Platform only / Both / Incremental only
If a segment underperformed last week, who has authority to kill it before next Monday — and what's the kill threshold in writing? Named owner + written threshold / Named owner only / Neither
What's the elapsed time from "we want to test a new creative variant for segment X" to "the variant is live in-channel"? <3 days / 4-10 days / >10 days
Can you state — in one sentence — what counts as a "re-engagement event" in your model? Yes, the team agrees / Yes, but only I know / No
What share of your AI investment in the last 12 months went to mid- and lower-funnel re-engagement versus top-of-funnel bidding/acquisition? >40% re-engagement / 20-40% / <20%
Scoring: 5+ answers in the leftmost (healthiest) column means your loop is operating. 3-4 means you have the pieces but not the cadence. 2 or fewer means you have a campaign calendar, not a loop — start with the Friday measurement step, since without it the rest is unmeasurable.
REFERENCES
Salesforce — State of Marketing (6th Edition)
Meta for Business — Advantage+ Shopping Campaigns Performance Results


Heading 1
Heading 2
Heading 3
Heading 4
Heading 5
Heading 6
Lorem ipsum dolor sit amet, consectetur adipiscing elit, sed do eiusmod tempor incididunt ut labore et dolore magna aliqua. Ut enim ad minim veniam, quis nostrud exercitation ullamco laboris nisi ut aliquip ex ea commodo consequat. Duis aute irure dolor in reprehenderit in voluptate velit esse cillum dolore eu fugiat nulla pariatur.
Block quote
Ordered list
- Item 1
- Item 2
- Item 3
Unordered list
- Item A
- Item B
- Item C
Bold text
Emphasis
Superscript
Subscript