Great user experience (UX) isn’t just about making things look good, it’s about making them work intuitively for the people who use them. That’s why tracking UX design metrics and in general UI/UX Design Services have become more critical than ever for businesses looking to win and retain users. Whether you're designing an MVP or refining a mature platform, using the right data to guide UX decisions is the secret weapon behind standout digital experiences.
This article will take you through the essential UX design metrics you need to monitor this year to ensure your product doesn’t just function, it thrives. We’ll explore everything from tactical measurements to high-level UX KPIs, diving into tools, strategies, and best practices for measuring the user experience.

Why Measuring the User Experience Matters?
Imagine you're launching a new app. You’ve got a sleek interface, cool animations, and all the features a user could want. But after the initial download spike, users vanish. What went wrong?
This is where measuring the user experience becomes indispensable.
Tracking UX data helps teams understand how users actually interact with a product, what frustrates them, what delights them, and where they drop off. Instead of guessing, you’re guided by clear evidence. It enables designers and developers to iterate based on real-world behavior, not assumptions, aligning product decisions with actual user needs.
When you measure UX effectively, you unlock insight into usability, engagement, retention, and conversion, core pillars of business success. In short, UX metrics turn subjective experience into strategic clarity.
UX Metrics vs UX KPIs – What's the Difference?
Before we dive into the details, let’s draw a line between UX metrics and UX KPIs. They often get used interchangeably, but they serve different roles.
- UX metrics are tactical. They focus on specific interactions, like how long it takes to complete a task or how often users encounter errors.
- UX KPIs (Key Performance Indicators), on the other hand, are strategic. They measure how UX contributes to overarching business goals, retention, conversion, and user satisfaction.
Think of UX metrics as the building blocks, while UX KPIs are the blueprint that ties it all together. Understanding both allows teams to align design execution with business impact.
The Impact of Metrics on Business Outcomes
Still not convinced? Let’s connect the dots.
When you use UX data to identify pain points and make evidence-based design changes, the results speak for themselves. You reduce friction, increase user satisfaction, and boost engagement. Over time, this leads to higher customer retention and better conversion rates.
UX metrics are your compass. They help ensure every decision moves your product closer to what your users and your business need. That’s a measurable competitive advantage.
Core UX Design Metrics You Should Track
So, which ux design metrics really matter? Let’s walk through the foundational metrics to measure user experience that should be on every product team’s radar.
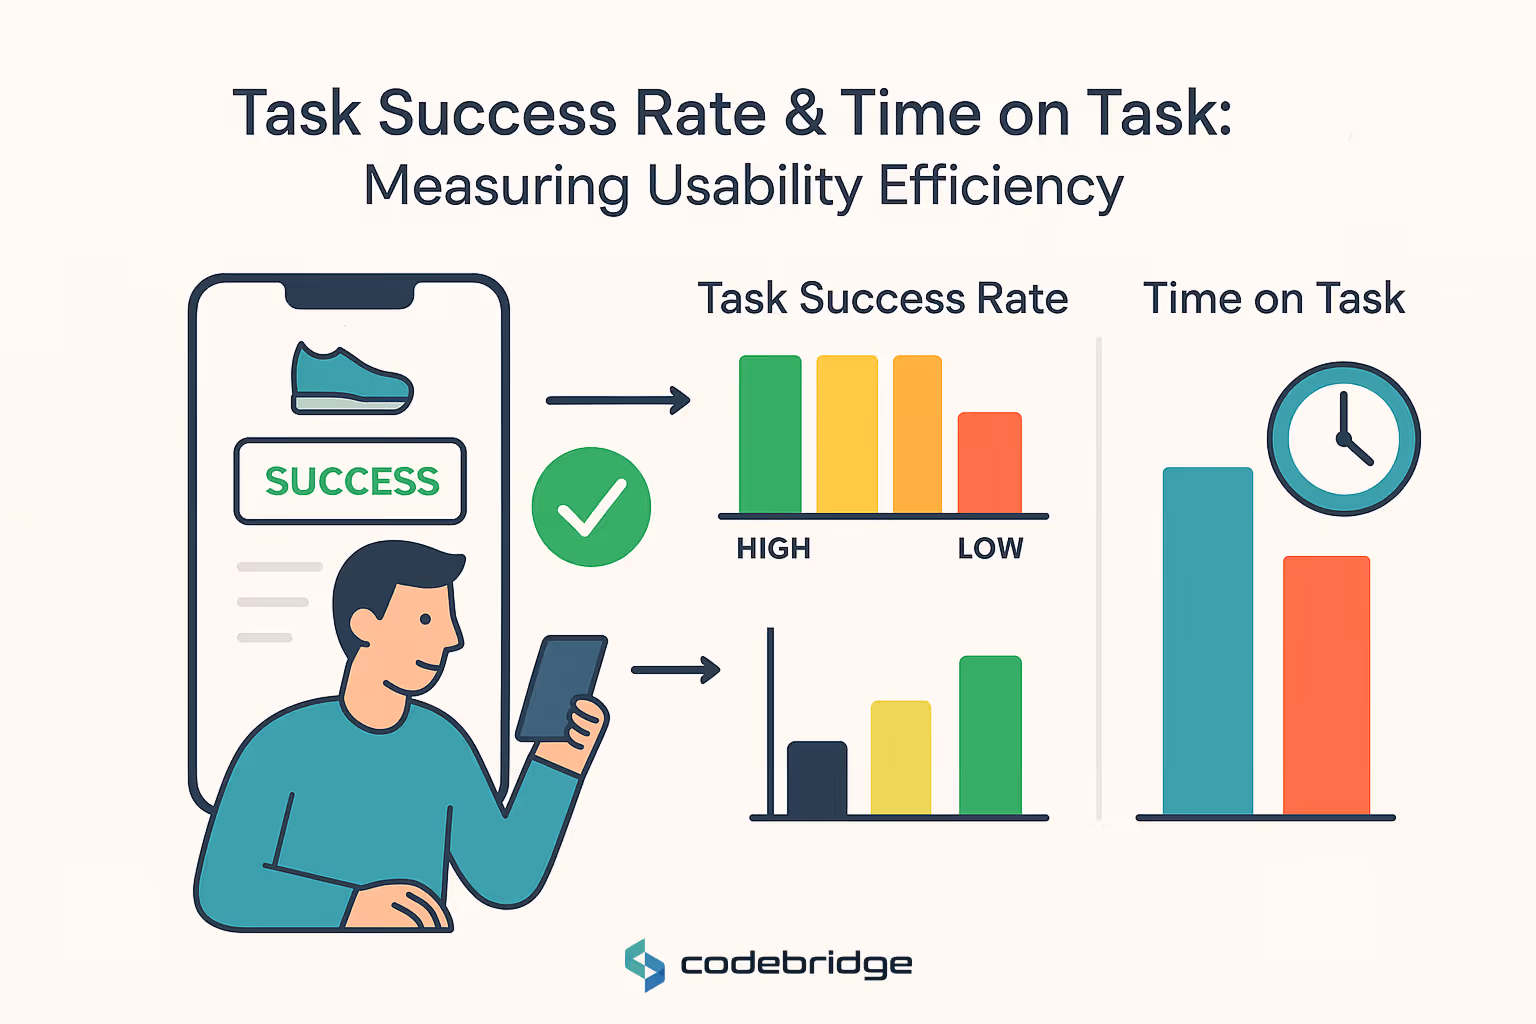
Task Success Rate and Time on Task
These are two of the most telling indicators of usability.
- Task Success Rate shows what percentage of users complete a given task successfully. High success rates mean your interface is intuitive.
- Time on Task measures how long it takes to finish a task. Ideally, it should be short and efficient, without sacrificing accuracy.
Together, these metrics offer a snapshot of how smooth (or clunky) the user journey feels.
Error Rate and Drop-Off Rate
- Error Rate reveals how often users make mistakes while interacting with your product, missed clicks, form input errors, or failed submissions.
- Drop-Off Rate shows where users abandon a process, like midway through sign-up or just before checkout.
Tracking these helps you spot and fix friction points before they become deal-breakers.
Net Promoter Score (NPS) and SUS
- NPS (Net Promoter Score) gauges user loyalty, “How likely are you to recommend us?” It’s simple but powerful.
- System Usability Scale (SUS) is a standardized survey that captures perceived usability. It translates subjective experience into quantifiable insight.
Both are high-level reflections of user satisfaction and trust.
UX KPIs for Product Teams and Business Stakeholders
Beyond individual metrics, UX KPIs give business leaders a way to track the long-term value of good design. Let’s look at the heavy hitters.

Retention Rate and Feature Adoption
- Retention Rate measures how many users come back after their first visit. It reflects long-term engagement and product value.
- Feature Adoption shows which features users actually use (and which ones they ignore), guiding future development priorities.
These KPIs are essential for keeping product teams aligned with real user needs.
Conversion Metrics and Funnel Completion
- Conversion Metrics track actions tied to business outcomes, sign-ups, purchases, subscriptions.
- Funnel Completion Rate monitors how users progress through multi-step processes.
Together, they link UX improvements directly to revenue growth. That’s ROI in action.
Key UX Metrics for Startups and MVPs
When you're building something new, you can't afford to fly blind. Startups need key UX metrics for startups that help them move fast and learn faster.
Time to First Action & Onboarding Completion
- Time to First Action tells you how quickly users start engaging. A long delay could mean poor clarity or confusing UI.
- Onboarding Completion measures how many users finish the initial setup or tutorial, an early indicator of activation success.
These metrics are gold when validating product-market fit.
Churn and Early User Feedback Loops
- Churn Rate measures how quickly users leave your product.
- Early User Feedback, via surveys, in-app messages, or interviews, helps uncover what’s missing or broken.
Using this feedback to shape iterations creates a responsive, user-first culture from the start.
Tools for UX Analytics and Measurement
Now that we know what to measure, let’s talk about how. Enter the world of ux analytics tools, your data-powered allies in building better experiences.
Heatmaps, Session Recording, and Funnel Tracking
Visual tools like Hotjar, FullStory, and Crazy Egg show you what users do, where they click, scroll, and stop.
- Heatmaps reveal attention hotspots.
- Session Recordings let you watch real user journeys.
- Funnel Tracking identifies where users drop off.
These tools make abstract behavior data visible and actionable.
Product Analytics Platforms
For deeper analysis, platforms like Mixpanel, Amplitude, and UXCam track user events, cohorts, and retention trends.
They help teams answer complex questions like:
- Who uses this feature the most?
- What’s the user path that leads to conversion?
- Where are users dropping off and why?
These platforms transform raw data into smart decisions.
UX Research Metrics & Usability Testing Insights
Sometimes numbers aren’t enough, you need human context. That’s where ux research metrics and product usability testing shine.
Metrics from Moderated Usability Testing
In one-on-one sessions, watch users attempt tasks while noting:
- Time on Task
- Task Completion Rates
- Observed Confusion or Frustration
You’ll uncover usability issues that even the best analytics dashboard might miss.
Post-Test Surveys and Behavioral Analytics
After testing, use:
- System Usability Scale (SUS)
- Custom open-ended surveys
- Behavior tracking over time
This hybrid approach, quantitative and qualitative, delivers the richest insights for product improvement.
Final Thoughts
Great UX doesn’t just happen, it’s engineered, iterated, and informed by data. Whether you’re a startup chasing product-market fit or an enterprise optimizing user journeys at scale, UX design metrics are your secret to unlocking better business outcomes.
By tracking the right data, aligning it with goals, and listening closely to user behavior, you can create experiences that not only work but wow. Looking for a team that turns UX insights into impact? Get a free consultation with Codebridge today to explore our tailored solutions and expert consulting!
FAQ
What are the most important UX design metrics for measuring business success?
Key UX metrics include user satisfaction (CSAT), task success rate, time on task, Net Promoter Score (NPS), user retention, and conversion rate. These metrics reveal how effectively your product meets user needs and contributes to business growth.
How does task success rate help evaluate UX performance?
Task success rate measures how easily users can complete key actions in your product. A high success rate indicates intuitive design and efficient user flows. Improving this metric leads to stronger engagement and higher conversion rates.
Why is user satisfaction (CSAT) critical for business success?
CSAT reflects how users feel about the overall experience. High satisfaction drives customer loyalty, reduces churn, and increases referrals. Tracking CSAT helps teams identify areas for improvement and measure the impact of UX updates.
How can Net Promoter Score (NPS) reveal long-term product value?
NPS measures how likely users are to recommend your product to others. A high NPS indicates strong trust and perceived value, which directly correlates with customer retention and organic growth. It is one of the most powerful indicators of long-term success.
Why should businesses track user retention as a UX metric?
Retention reveals how valuable users find the product over time. Strong UX keeps users engaged and reduces drop-off. Monitoring retention helps teams understand product stickiness and identify friction points that may cause users to leave.
How does conversion rate relate to UX quality?
Conversion rate measures how effectively users move through the product funnel. Clear navigation, persuasive design, and seamless user flows improve conversions. Tracking this metric helps businesses optimize onboarding, checkout processes, and key product interactions.


Heading 1
Heading 2
Heading 3
Heading 4
Heading 5
Heading 6
Lorem ipsum dolor sit amet, consectetur adipiscing elit, sed do eiusmod tempor incididunt ut labore et dolore magna aliqua. Ut enim ad minim veniam, quis nostrud exercitation ullamco laboris nisi ut aliquip ex ea commodo consequat. Duis aute irure dolor in reprehenderit in voluptate velit esse cillum dolore eu fugiat nulla pariatur.
Block quote
Ordered list
- Item 1
- Item 2
- Item 3
Unordered list
- Item A
- Item B
- Item C
Bold text
Emphasis
Superscript
Subscript