Software development has become the backbone of modern business operations, yet many CEOs struggle to understand what metrics truly matter for their engineering investments.
The global software market is estimated at USD 730.7 billion in 2024, projected to reach USD 1,397.3 billion by 2030, according to Grand View Research Forecast.
While traditional business metrics focus on revenue and costs, software metrics require a different lens, one that balances speed, quality, and business impact. For organizations ready to transform their engineering measurement capabilities, professional custom software development partnerships can provide the expertise and implementation support needed to establish world-class metrics programs.
This comprehensive guide provides executives with the essential metrics framework needed to make data-driven decisions about their engineering organizations.

Why Metrics Matter for CEOs (Clarity, Control, Confidence)
The fundamental challenge facing executive teams is distinguishing between engineering activity and business outcomes. Traditional metrics like lines of code written or story points completed provide little insight into actual value delivery. Instead, CEOs need metrics that answer critical business questions: Are we delivering features that customers use? Is our technical investment reducing risk or creating it? How quickly can we respond to market opportunities?
Modern software metrics must bridge the gap between technical execution and business strategy. The most effective metrics tell a story that spans from individual developer productivity through team effectiveness to customer impact. This requires moving beyond vanity metrics toward measurements that directly correlate with business performance, customer satisfaction, and competitive advantage.
Aligning Engineering KPIs to Strategy (Revenue, Margin, Risk)
Engineering KPIs become strategic weapons when properly aligned with business objectives. Revenue alignment means tracking how quickly engineering can deliver revenue-generating features and how often those features drive actual adoption. Margin considerations involve understanding the true cost of feature development, including technical debt and operational overhead. Risk management requires visibility into security vulnerabilities, system reliability, and the potential business impact of technical failures.
The most successful organizations establish clear connections between engineering metrics and business outcomes. This alignment enables informed trade-offs between speed and quality, helps prioritize technical investments, and ensures engineering efforts directly support strategic objectives rather than optimizing for purely technical metrics.
Delivery Excellence: The DORA Metrics CEOs Need to Know
The DevOps Research and Assessment (DORA) team has identified four key metrics that consistently correlate with high-performing engineering organizations. These metrics, backed by over a decade of research across thousands of organizations, provide the foundation for measuring software delivery performance.
Lead Time for Changes (Definition, Formula, Data Source, Targets)
Definition: Lead Time for Changes measures the time from code commit to production deployment. This metric captures the efficiency of your entire software delivery pipeline and indicates how quickly your organization can respond to market opportunities or customer needs.
Formula: Lead Time = Production Deploy Time - First Commit Time
Data Source: Version control systems (GitHub, GitLab) combined with CI/CD pipeline tools (Jenkins, CircleCI) provide the timestamps needed for accurate calculation.
Healthy Ranges:
.avif)
- Elite: Less than 1 hour
- High: Between 1 day and 1 week
- Medium: Between 1 week and 1 month
- Low: Between 1 month and 6 months
Deployment Frequency (Cadence by Product Type)
Definition: Deployment Frequency measures how often code changes are successfully deployed to production. Higher frequency typically indicates more mature development processes and reduced deployment risk.
Calculation: Deployment Frequency = Total Deployments / Time Period
Industry Benchmarks by Product Type:
- Web Applications: Multiple times per day (elite teams)
- Mobile Applications: Weekly to monthly (due to app store review processes)
- Enterprise Software: Weekly to bi-weekly
- Regulated Industries: Monthly to quarterly (compliance requirements)
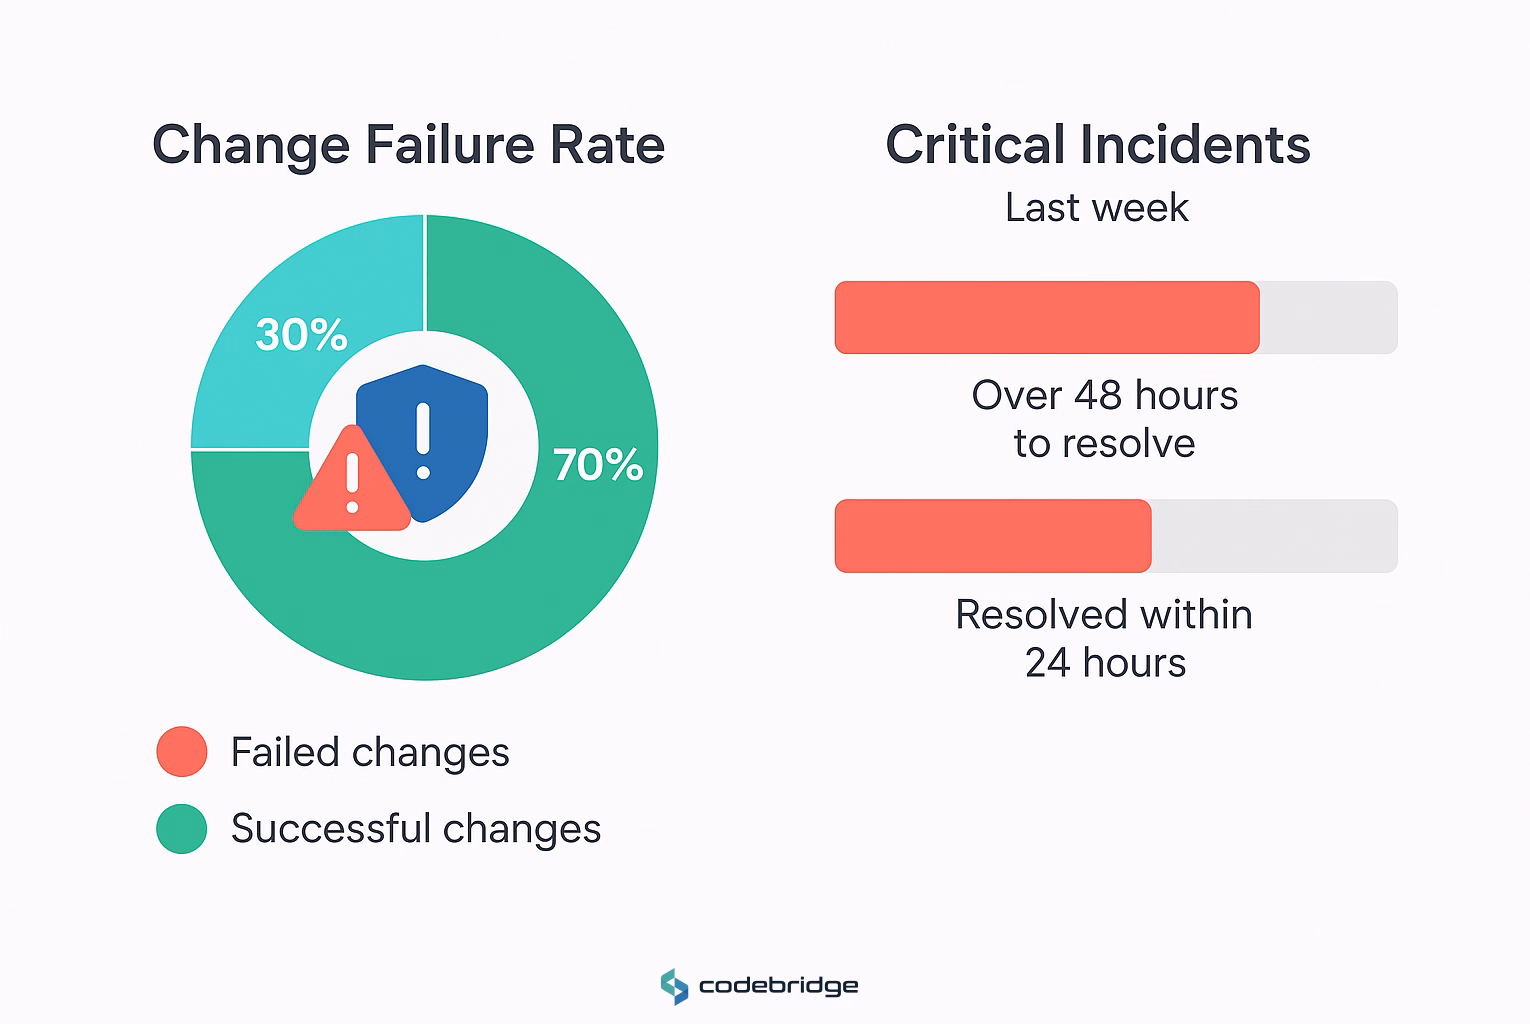
Change Failure Rate (Defects/Incidents per Deploy)
Definition: Change Failure Rate represents the percentage of deployments that cause production failures requiring immediate remediation.
Formula: Change Failure Rate = (Failed Deployments / Total Deployments) × 100
Target Ranges:
- Elite: 0-15%
- High: 16-30%
- Medium: 16-30%
- Low: 46-60%
MTTR (Restore vs Resolve, Paging Discipline)
Mean Time to Restore (MTTR) measures how quickly teams can recover from production failures. This metric distinguishes between detection time, resolution time, and full service restoration, providing insight into incident response effectiveness.
Calculation Methods:
- Time to Detect: Monitoring system alerts to human acknowledgment
- Time to Resolve: Incident start to root cause elimination
- Time to Restore: Service degradation to full functionality restoration
Target Ranges:
- Elite: Less than 1 hour
- High: Less than 1 day
- Medium: Between 1 day and 1 week
- Low: Between 1 week and 1 month
.avif)
Flow & Planning: Software Engineering Metrics Beyond DORA
Cycle time provides granular insight into development workflow efficiency by measuring the total time from work initiation to production deployment. Understanding the breakdown between queue time (waiting) and touch time (active work) reveals bottlenecks and optimization opportunities.
Components of Cycle Time:
- Coding Time: First commit to pull request creation
- Pickup Time: PR creation to first review
- Review Time: Review start to approval
- Deploy Time: Merge to production release
Industry Benchmarks:
- Elite Teams: Under 26 hours total cycle time
- Teams Needing Improvement: Over 167 hours
The key insight is that shorter cycle times correlate with higher code quality, as extended development cycles increase the likelihood of conflicts and outdated dependencies.
Throughput & WIP (Little's Law; WIP Limits)
Little's Law (Throughput = WIP / Cycle Time) provides a mathematical framework for optimizing development flow. This relationship demonstrates that reducing work-in-progress (WIP) and cycle time increases overall throughput without requiring additional resources.
WIP Management Benefits:
- Reduced context switching overhead
- Improved focus on completion over starting new work
- Earlier feedback and faster error detection
- More predictable delivery schedules
PR Size & Review Time (Impact on Quality/Velocity)
Pull request size directly impacts both review quality and overall development velocity. Research consistently shows that smaller PRs receive more thorough reviews, contain fewer defects, and merge faster than large changes.
Optimal PR Size Guidelines:
- Target: Under 200 lines of code changed
- Elite Teams: Under 85 lines changed
- Problem Threshold: Over 400 lines (poor review quality)
Impact on Velocity: Small PRs move through the development pipeline up to 5x faster than large PRs, with significantly better review quality and lower defect rates.
Forecast Accuracy & Roadmap Confidence (Probabilistic Delivery)
Accurate forecasting enables better business planning and stakeholder confidence. Modern forecasting approaches use historical cycle time data to provide probabilistic delivery estimates rather than deterministic commitments.
Key Components:
- Historical cycle time distributions
- Work complexity estimation
- Confidence intervals for delivery dates
- Regular forecast accuracy measurement and improvement
Protecting Customer Experience
Escaped Defect Rate measures the percentage of defects that reach production despite testing efforts. This metric directly indicates the effectiveness of quality assurance processes and impacts customer satisfaction.
Formula: Escaped Defect Rate = (Production Defects / Total Defects) × 100
Industry Standards:
- Target: Below 5%
- Acceptable: 5-10%
- Needs Improvement: Above 10%
Calculation Example: If 20 defects reach production out of 100 total defects identified, the escape rate is 20%.
Crash-free metrics provide direct insight into application stability and user experience. These metrics are calculated as aggregations over time, not averages, making them particularly valuable for understanding user impact.
Mobile Benchmarks:
- Acceptable: 99.95% crash-free sessions, 99% crash-free users
- Industry Median: 99.94% crash-free sessions
- Target for Large Apps: 99.99%+ crash-free users
Web Application Considerations: Web apps typically see different patterns than mobile apps due to browser diversity and network conditions.
Availability SLO & Error Budget (Trade-offs with Speed)
Service Level Objectives (SLOs) define acceptable service performance, while error budgets quantify allowable unreliability. This framework enables data-driven trade-offs between feature velocity and system stability.
Error Budget Calculation:
- SLO: 99.9% availability over 30 days
- Error Budget: 0.1% = 43.2 minutes of downtime per month
- Policy: Stop feature releases when budget is exhausted
Trade-off Decisions:
- Budget Available: Focus on feature velocity and innovation
- Budget Low: Emphasize stability and reliability improvements
- Budget Exhausted: Freeze releases until reliability is restored
Performance KPIs (p50/p95 Latency, Core Web Vitals)
Performance metrics directly impact user experience and business outcomes. Key performance indicators should focus on user-perceived performance rather than purely technical metrics.
Essential Metrics:
- p50 Latency: Median response time (typical user experience)
- p95 Latency: 95th percentile response time (worst acceptable experience)
- Core Web Vitals: Google's user experience metrics for web applications
- Throughput: Requests handled per unit time under load
Risk Visibility for the Board
Vulnerability Backlog & SLA Compliance (Critical/High/Med)
Security vulnerability management requires clear SLAs and consistent tracking to ensure critical risks are addressed promptly. Different vulnerability severities demand different response timeframes.
Standard SLAs:
- Critical Vulnerabilities: 24-48 hours
- High-Risk Vulnerabilities: 30 days
- Medium-Risk Vulnerabilities: 60 days
- Low-Risk Vulnerabilities: 90 days
Key Metrics:
- SLA compliance rate by severity level
- Average time to remediation
- Vulnerability aging (days since disclosure)
- Backlog size trends by risk level
Dependency Freshness (SBOM, Update Cadence)
Modern applications rely heavily on third-party dependencies, making dependency management a critical security concern. Software Bill of Materials (SBOM) tracking and regular updates reduce security risk and technical debt.
Tracking Components:
- Age of dependencies (days since latest version)
- Number of known vulnerabilities in current versions
- Update frequency and success rate
- Critical dependency identification and monitoring
Availability SLO & Error Budget (Trade-offs with Speed)
Service Level Objectives (SLOs) define acceptable service performance, while error budgets quantify allowable unreliability. This framework enables data-driven trade-offs between feature velocity and system stability.
Error Budget Calculation:
- SLO: 99.9% availability over 30 days
- Error Budget: 0.1% = 43.2 minutes of downtime per month
- Policy: Stop feature releases when budget is exhausted
Trade-off Decisions:
- Budget Available: Focus on feature velocity and innovation
- Budget Low: Emphasize stability and reliability improvements
- Budget Exhausted: Freeze releases until reliability is restored
Performance KPIs (p50/p95 Latency, Core Web Vitals)
Performance metrics directly impact user experience and business outcomes. Key performance indicators should focus on user-perceived performance rather than purely technical metrics.
Essential Metrics:
- p50 Latency: Median response time (typical user experience)
- p95 Latency: 95th percentile response time (worst acceptable experience)
- Core Web Vitals: Google's user experience metrics for web applications
- Throughput: Requests handled per unit time under load
Risk Visibility for the Board
Security vulnerability management requires clear SLAs and consistent tracking to ensure critical risks are addressed promptly. Different vulnerability severities demand different response timeframes.
Standard SLAs:
- Critical Vulnerabilities: 24-48 hours
- High-Risk Vulnerabilities: 30 days
- Medium-Risk Vulnerabilities: 60 days
- Low-Risk Vulnerabilities: 90 days
Key Metrics:
- SLA compliance rate by severity level
- Average time to remediation
- Vulnerability aging (days since disclosure)
- Backlog size trends by risk level
Dependency Freshness (SBOM, Update Cadence)
Modern applications rely heavily on third-party dependencies, making dependency management a critical security concern. Software Bill of Materials (SBOM) tracking and regular updates reduce security risk and technical debt.
Tracking Components:
- Age of dependencies (days since latest version)
- Number of known vulnerabilities in current versions
- Update frequency and success rate
- Critical dependency identification and monitoring
Audit Trail Coverage & Access Reviews (SOX/ISO/SOC2 Alignment)
Compliance requirements necessitate comprehensive audit trails and regular access reviews. These metrics demonstrate governance effectiveness to auditors and board members.
Essential Coverage Areas:
- Code change tracking and approval workflows
- Production access logging and monitoring
- Automated compliance check results
- Access review completion rates and findings
Cost per Feature/Outcome (Allocation, Pitfalls)
Understanding the true cost of feature development enables better prioritization and resource allocation decisions. However, accurate cost allocation requires careful methodology to avoid misleading conclusions.
Allocation Approaches:
- Direct development time and resources
- Proportional infrastructure and tooling costs
- Quality assurance and testing overhead
- Ongoing maintenance and support requirements
Common Pitfalls:
- Ignoring shared infrastructure costs
- Underestimating long-term maintenance burden
- Failing to account for technical debt accumulation
- Oversimplifying complex feature interdependencies
Cloud Cost per Request/User (FinOps View)
Cloud unit economics provide insight into operational efficiency and scaling characteristics. Understanding cost per unit enables informed architecture and capacity planning decisions.
Key Unit Metrics:
- Cost per Request: Total cloud spend / API requests
- Cost per User: Infrastructure costs / active users
- Cost per Transaction: Processing costs / business transactions
- Resource Utilization: Actual usage / provisioned capacity
Maturity Levels:
- Crawl: Cloud spend as percentage of revenue
- Walk: API call or transaction costs
- Run: Cost per revenue-generating activity
Build/Run Split, Platform ROI, Tech-debt Interest
The balance between building new features and maintaining existing systems directly impacts long-term business sustainability. Platform investments and technical debt management require careful measurement and communication.
Build/Run Analysis:
- Percentage of engineering time on new features vs. maintenance
- Platform investment ROI through developer productivity gains
- Technical debt "interest" as ongoing maintenance overhead
- Infrastructure automation impact on operational costs
Proving Software Moves the Business
Time to Value (TTV) measures how quickly users realize meaningful benefit from new features or products. This metric directly correlates with user retention and business impact.
TTV Calculation:
- Definition: Time from first user interaction to first meaningful outcome
- Measurement: Sign-up to key action completion
- Optimization: Reduce barriers and improve onboarding flow
- Validation: A/B testing of different user journeys
Industry Patterns:
- SaaS products: Minutes to days for initial value
- Complex enterprise tools: Days to weeks for full adoption
- Developer tools: Hours to first successful use case
Feature Adoption, Retention Lift, Deflection (Support)
Feature adoption metrics reveal which investments drive actual user value and business outcomes. Understanding adoption patterns enables better product prioritization and resource allocation.
Core Adoption Metrics:
- Feature Adoption Rate: (Feature Users / Total Users) × 100
- Time to Adopt: Days from feature release to first use
- Adoption Depth: Frequency and breadth of feature usage
- Retention Impact: User retention before/after feature adoption
Business Impact Measurement:
- Support ticket volume reduction from self-service features
- User engagement lift from new capabilities
- Revenue correlation with feature adoption rates
CSAT/NPS for Shipped Features (Quality Signal)
Customer satisfaction metrics for specific features provide direct feedback on product investment effectiveness. Post-release satisfaction surveys enable rapid iteration and improvement.
Measurement Approaches:
- CSAT: Satisfaction with specific feature interactions
- NPS: Likelihood to recommend based on feature experience
- Feature-specific surveys: Targeted feedback on new capabilities
- Usage correlation: Satisfaction scores vs. actual feature usage
Implementation Best Practices:
- Survey timing: Shortly after feature interaction
- Response rate optimization: Short, contextual surveys
- Trend analysis: Track satisfaction changes over time
- Action planning: Clear process for addressing feedback
Satisfaction & Focus Time (Maker Time vs Meetings)
Developer satisfaction directly correlates with productivity, retention, and code quality. The SPACE framework emphasizes satisfaction as a leading indicator of future performance challenges.
Key Satisfaction Drivers:
- Meaningful Work: Alignment with personal and company goals
- Autonomy: Decision-making authority and tool choice flexibility
- Mastery: Learning opportunities and skill development
- Work-Life Balance: Sustainable pace and flexible arrangements
Focus Time Measurement:
- Uninterrupted coding blocks (minimum 2-4 hours)
- Meeting density and distribution patterns
- Context switching frequency and impact
- Deep work vs. collaborative time balance
Collaboration Signals (Review Participation, Handoffs)
Effective collaboration drives team performance while maintaining individual productivity. Measuring collaboration requires both quantitative activity metrics and qualitative interaction assessment.
Collaboration Metrics:
- Code Review Participation: Reviews given/received ratio
- Knowledge Sharing: Documentation contributions and peer helping
- Cross-team Communication: Inter-team project participation
- Mentoring Activities: Junior developer support and guidance
Healthy Collaboration Patterns:
- Distributed review participation (not concentrated in few people)
- Timely review feedback (within 24-48 hours)
- Constructive feedback quality and helpfulness
- Knowledge distribution across team members
Activity ≠ Outcomes (Why Lines of Code/Story Points Mislead)
Traditional activity metrics like lines of code and story points fail to capture actual productivity and can drive counterproductive behaviors. Modern productivity measurement focuses on outcomes and impact rather than output volume.
Why Activity Metrics Mislead:
- Lines of Code: Rewards verbose solutions over elegant ones
- Story Points: Gamification leads to point inflation over time
- Commit Frequency: Encourages meaningless commits for metric optimization
- Hours Worked: Conflates time spent with value delivered
Outcome-Focused Alternatives:
- Code review effectiveness and quality feedback
- Feature completion and business impact measurement
- Problem-solving speed and solution elegance
- Customer satisfaction with delivered capabilities
The Executive Software KPI Dashboard (Template)
Executive dashboards must balance comprehensive coverage with actionable insight. The most effective dashboards present information at appropriate time scales and focus on metrics that enable strategic decision-making.
Weekly Dashboard (Operational Focus):
Deployment Frequency: Release velocity trends
Change Failure Rate: Quality and stability indicators
Critical Incidents: Production issues and resolution times
Sprint Progress: Current iteration delivery confidence
Security Alerts: High-priority vulnerability status
Team Satisfaction: Developer happiness and concern signals
Red/Amber/Green Thresholds & Trend Arrows
Clear visual indicators enable rapid executive decision-making without requiring deep technical context. Thresholds should be based on historical performance, industry benchmarks, and business risk tolerance.
Status Indicator Framework:
- Green: Performance meets or exceeds targets, positive trends
- Amber: Performance acceptable but showing concerning trends
- Red: Performance below thresholds, immediate attention required
- Trend Arrows: 30-day directional indicators independent of absolute status
Benchmarks by Product Type (B2B SaaS, Consumer, Regulated)
Software performance benchmarks vary significantly across industries, product types, and organizational contexts. Understanding these variations prevents inappropriate comparisons and sets realistic improvement targets.
B2B SaaS Benchmarks:
- Deployment Frequency: Daily to weekly releases
- Lead Time: 1-7 days for most changes
- Change Failure Rate: 10-20% acceptable
- Feature Adoption: 30-50% within first month
Consumer Applications:
- Deployment Frequency: Multiple daily releases
- Crash-Free Users: 99.95%+ required
- Performance: Sub-second response times critical
- Feature Adoption: 15-40% typical range
Regulated Industries:
- Deployment Frequency: Weekly to monthly cycles
- Change Documentation: 100% compliance required
- Security Response: 24-hour SLAs for critical issues
- Audit Trail: Complete change tracking mandatory
How to Set Goals (Percentile Moves, Quartile Leaps)
Effective goal setting balances ambition with realism, using historical performance data to establish achievable yet meaningful improvements. Percentile-based goals provide clearer targets than arbitrary percentage improvements.
Goal-Setting Framework:
- Current State Analysis: Establish baseline performance across all metrics
- Percentile Assessment: Determine current performance percentile vs. industry
- Target Selection: Aim for next quartile improvement over 6-12 months
- Milestone Planning: Break large improvements into achievable increments
Example Goal Structure:
- Current: 70th percentile deployment frequency (weekly releases)
- Target: 85th percentile deployment frequency (daily releases)
- Timeline: 6-month improvement plan with monthly checkpoints
- Investment: Tooling, training, and process improvements required
Antipatterns and Metric Gaming (Goodhart's Law)
Goodhart's Law states that "when a measure becomes a target, it ceases to be a good measure." Understanding and preventing metric gaming is essential for maintaining measurement system integrity and avoiding counterproductive behaviors.
Common Gaming Patterns:
- Deployment Frequency Gaming: Meaningless commits to inflate numbers
- Lead Time Gaming: Cherry-picking simple changes for measurement
- Story Point Gaming: Inflating estimates to appear more productive
- Test Coverage Gaming: Writing tests that don't verify functionality
Prevention Strategies:
- Balanced Scorecards: Use multiple related metrics to prevent gaming
- Qualitative Reviews: Regular human assessment of quantitative data
- Metric Rotation: Periodically change specific measurements while maintaining intent
- Culture Focus: Emphasize learning and improvement over target achievement
How to Implement This in 30/60/90 Days
0–30: Instrument Data, Define Glossary, Choose Dashboard
The first month focuses on establishing measurement foundations without overwhelming teams or making premature optimization decisions.
Week 1-2: Assessment and Planning
- Audit existing tools and data sources
- Interview key stakeholders about current pain points
- Define initial metric glossary with clear definitions
- Identify immediate data collection gaps
Week 3-4: Basic Instrumentation
- Configure deployment frequency tracking via CI/CD
- Establish lead time measurement from version control
- Set up basic incident tracking and MTTR calculation
- Create simple dashboard with 3-5 core metrics
31–60: Baseline + Set Targets, Review Ritual, Fix Top Bottleneck
Month two emphasizes establishing baselines, setting realistic targets, and beginning improvement initiatives based on data insights.
Week 5-6: Baseline Establishment
- Collect 4-6 weeks of consistent metric data
- Calculate current performance percentiles
- Identify top 3 improvement opportunities
- Set preliminary targets for 90-day horizon
Week 7-8: Process and Ritual Creation
- Establish weekly metric review meetings
- Create monthly executive dashboard reporting
- Define escalation procedures for metric thresholds
- Begin addressing highest-impact bottleneck identified
61–90: Automate Alerts, Link Metrics to Incentives & Planning
The final month focuses on embedding metrics into organizational processes and ensuring sustainable long-term improvement.
Week 9-10: Automation and Integration
- Implement automated alerts for critical metric thresholds
- Integrate metrics into sprint planning and roadmap discussions
- Connect performance data to team retrospectives and improvement planning
- Establish quarterly metric review and target adjustment process
Week 11-12: Culture and Incentive Alignment
- Link team objectives to key performance metrics
- Establish recognition programs for metric improvements
- Create monthly metric improvement challenges
- Begin planning for advanced metrics introduction in quarter 2
Tools & Data Sources
Modern software development metrics require data integration across multiple tool categories. Each tool type provides specific data essential for comprehensive measurement.
Version Control Systems (GitHub, GitLab, Bitbucket):
- Commit timestamps and author information
- Pull request creation, review, and merge data
- Branch lifetime and merge conflict resolution times
- Code review participation and quality metrics
CI/CD Pipeline Tools (Jenkins, CircleCI, GitHub Actions):
- Deployment frequency and success rates
- Build time trends and failure analysis
- Pipeline stage duration breakdown
- Deployment rollback and failure recovery data
Issue Tracking (Jira, Linear, Azure DevOps):
- Work item cycle times and throughput
- Sprint burndown and velocity calculations
- Defect creation and resolution tracking
- Feature delivery timeline analysis
Observability Platforms (DataDog, New Relic, Splunk):
- Application performance and latency metrics
- Error rate and availability measurements
- Infrastructure utilization and scaling patterns
- User experience and transaction tracing
Product Analytics (Mixpanel/GA/Amplitude), Cloud Cost Tools
Business impact measurement requires specialized analytics and cost management platforms that connect technical delivery to user behavior and financial outcomes.
Product Analytics Tools:
- Mixpanel: Event tracking and funnel analysis for feature adoption
- Amplitude: User journey analysis and retention measurement
- Google Analytics: Web traffic and conversion tracking
- Hotjar/FullStory: User session recording and behavior analysis
Cloud Cost Management:
- AWS Cost Explorer: Detailed cost breakdown and trend analysis
- Google Cloud Billing: Resource utilization and cost allocation
- Azure Cost Management: Budget tracking and optimization recommendations
- Third-party FinOps platforms: Multi-cloud cost optimization and unit economics
Data Warehouse/BI and Ownership (Single Source of Truth)
Comprehensive software metrics require centralized data collection, transformation, and presentation. Establishing clear data ownership prevents inconsistent reporting and enables trusted decision-making.
Data Architecture Components:
- Extract/Transform/Load (ETL): Automated data collection from source systems
- Data Warehouse: Centralized storage with consistent schemas and definitions
- Business Intelligence: Visualization and reporting layers for different audiences
- Data Governance: Clear ownership, update schedules, and quality monitoring
Implementation Considerations:
- Single source of truth for each metric to prevent conflicting reports
- Automated data pipeline monitoring and alerting
- Role-based access control for sensitive performance data
- Regular data quality audits and correction procedures
Final Call to Action
Software development metrics represent a strategic competitive advantage when implemented thoughtfully and systematically. Organizations that master these measurements can make faster, more informed decisions about technology investments, reduce risk through early problem detection, and demonstrate clear connections between engineering work and business outcomes.
The journey from ad-hoc engineering management to data-driven development optimization requires commitment, proper tooling, and often external expertise to avoid common implementation pitfalls. The metrics framework presented here provides CEOs with the foundation needed to understand, measure, and optimize their software development organizations.
FAQ
What are the most important engineering KPIs for CEOs?
Start with the four DORA metrics, Lead Time for Changes, Deployment Frequency, Change Failure Rate, and MTTR, then layer on cycle time, WIP/throughput, PR size, customer-experience KPIs (crash-free users, p95 latency, Core Web Vitals), security SLAs, and FinOps unit economics (cost per user/request/transaction).
What are DORA metrics and what targets should we use?
- Lead Time for Changes: commit → production; elite < 1 hour
- Deployment Frequency: from on-demand (web) to weekly (mobile/regulated)
- Change Failure Rate: 0–15% elite
- MTTR: recover in < 1 hour (elite)
Benchmarks vary by product type and compliance environment.
Cycle Time vs Lead Time, what’s the difference and why care?
Lead time tracks commit → deploy; cycle time spans idea → deploy, broken into coding, pickup, review, and release. Shorter cycle times correlate with higher quality and predictability. Elite teams keep total cycle time to ~< 26 hours.
How do WIP limits improve throughput?
By Little’s Law (Throughput = WIP / Cycle Time): lowering WIP and cycle time raises throughput without adding headcount, reducing context switching and accelerating feedback.
What PR size drives quality and velocity?
Aim for < 200 LOC per PR (elite ~< 85 LOC). Oversized PRs (> 400 LOC) slow reviews, hide defects, and hurt flow efficiency.


Heading 1
Heading 2
Heading 3
Heading 4
Heading 5
Heading 6
Lorem ipsum dolor sit amet, consectetur adipiscing elit, sed do eiusmod tempor incididunt ut labore et dolore magna aliqua. Ut enim ad minim veniam, quis nostrud exercitation ullamco laboris nisi ut aliquip ex ea commodo consequat. Duis aute irure dolor in reprehenderit in voluptate velit esse cillum dolore eu fugiat nulla pariatur.
Block quote
Ordered list
- Item 1
- Item 2
- Item 3
Unordered list
- Item A
- Item B
- Item C
Bold text
Emphasis
Superscript
Subscript