


Skipping or rushing discovery is one of the most expensive mistakes a startup or scale-up can make. Industry research shows that unclear requirements and problem misalignment can double delivery timelines due to rework, scrapped features, and missed user expectations. Aligning your discovery outcomes with MVP scope? Read our MVP readiness guide.
This guide is written for CTOs, Heads of Product, and engineering leaders who want to transform discovery from an occasional exercise into a predictable, repeatable practice that accelerates delivery instead of slowing it down.
We’ll cover:
- How to frame problems before jumping to solutions.
- The roles, rituals, and artifacts that keep dual-track agile from turning into chaos.
- The research methods, prioritization tools, and sprint formats that de-risk delivery.
- How to prove discovery improves speed with measurable metrics.
And yes, we’ll give you a 30/60/90-day rollout plan for making discovery a permanent muscle in your product organization.
.avif)
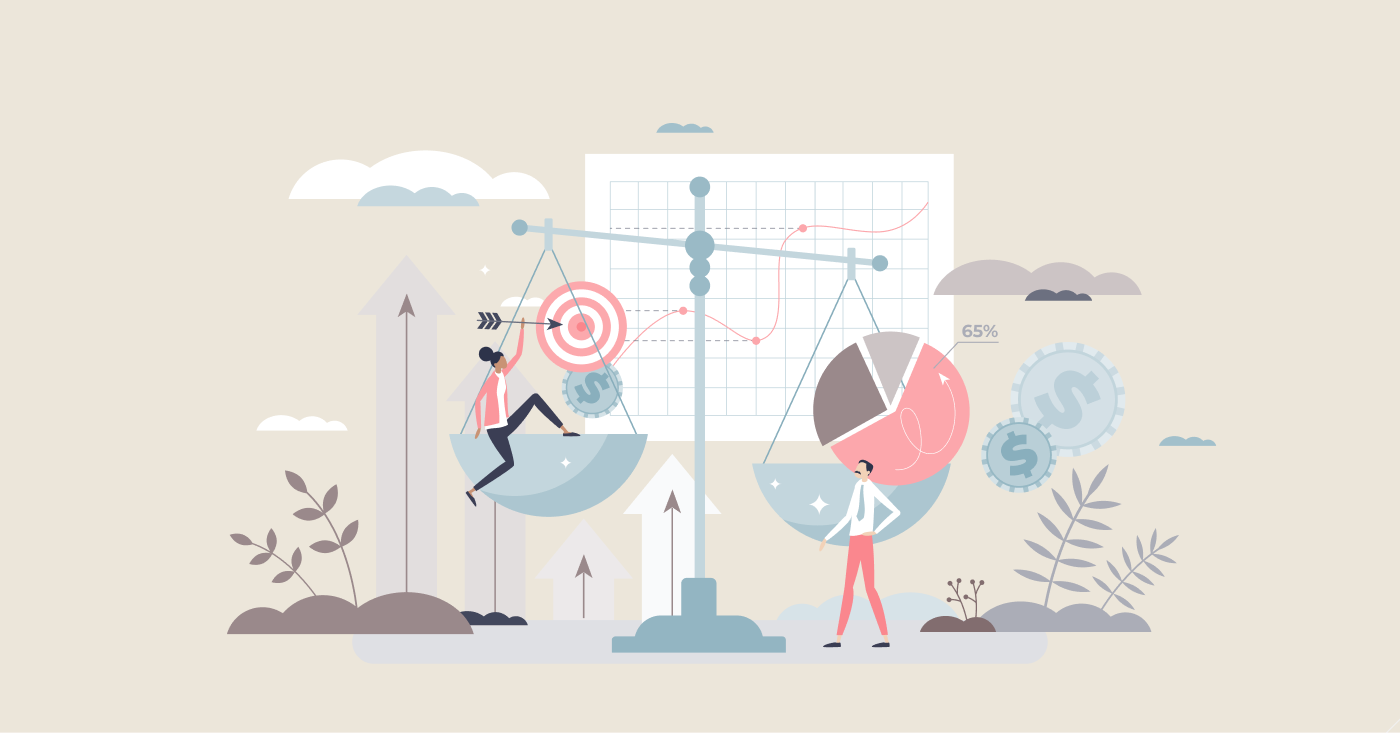
Why the Product Discovery Process Determines Delivery Speed
Discovery isn’t overhead; it’s an investment that pays back in reduced rework, fewer production surprises, and faster market feedback.
Rework Math: Why Unclear Problems Double Lead Time
Let’s put numbers to it: imagine a feature scheduled for an eight-week build. If your team realizes halfway through that the feature solves the wrong problem or needs major rework due to unclear requirements, you’ve effectively turned that eight weeks into twelve or more. For every week of discovery skipped, you can lose two weeks in delivery. This “rework multiplier” is why elite product teams treat discovery as a non-negotiable stage.
Define Outcomes Before Backlog
Before you fill Jira with tickets, define your north star metric and OKRs. If your backlog items don’t clearly connect to these outcomes, you’re at risk of building activity without impact.
For example:
- North Star Metric: “Active monthly users completing 3+ transactions”
- Key Result: Increase conversion from trial to paid by 15% in Q2.
Discovery ensures you have clear hypotheses for how each backlog item moves those needles.
Product Discovery vs Delivery, Dual-Track Without the Drama
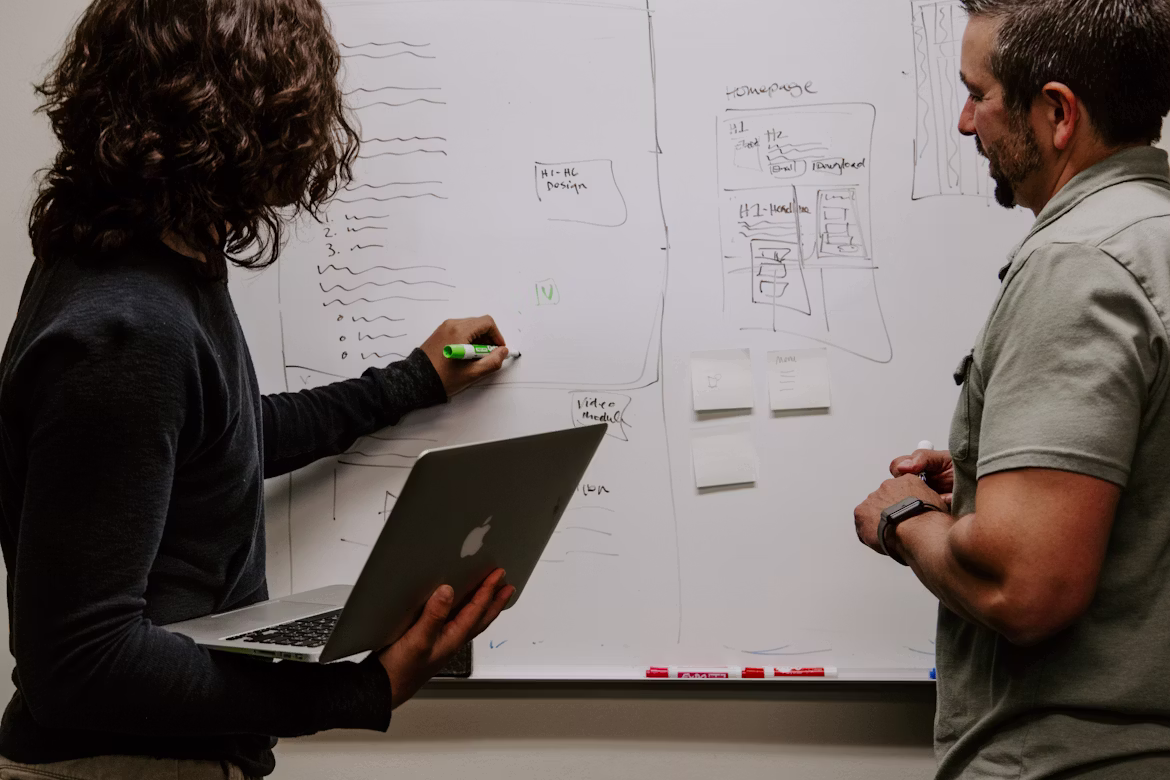
Discovery and delivery can run in parallel, but only if roles, artifacts, and handovers are crisp.
Roles & Cadence
The PM/Design/Engineering triad is your core discovery unit.
- PM: Frames the problem, aligns stakeholders, drives prioritization.
- Designer: Explores user flows, prototypes, and validates usability.
- Engineer: Flags feasibility, tech constraints, and integration risks early.
Weekly rituals for syncs, and continuous research running alongside delivery ensure you’re feeding validated work into the build track.
Handover Artifacts
Forget 40-page PRDs. Your delivery team needs lean but rich inputs:
- Hypothesis Sheet – Problem statement, target segment, success metric.
- Decision Log – Why we chose this approach, rejected alternatives.
- PRD-lite – Acceptance criteria, UX sketches, constraints.
.avif)
Framing the Problem (Assumptions → Hypotheses)
Jumping to solutions is the fastest way to waste engineering cycles.
Instead, start with assumption mapping to surface what you believe vs. what you actually know.
Assumption Mapping & Risk Matrix
Map assumptions across desirability, feasibility, and viability:
- Desirability – Do users want it?
- Feasibility – Can we build it within constraints?
- Viability – Will it support our business goals?
Prioritize high-risk, high-unknown assumptions for early validation.
Jobs to Be Done & Problem Statements
Reframe features as jobs users hire your product to do.
Example: “As a small business owner, I want to automatically send invoice reminders so I get paid faster without chasing clients.”
Opportunity Solution Tree
Visualize the path from desired outcome → opportunities → solutions.
This prevents solution bias and ensures every concept is tied back to an outcome.
Checklist: Problem Framing Template
- State the desired outcome (quantitative)
- List assumptions by risk & evidence
- Draft the problem statement
- Map opportunities in an OST
- Identify the riskiest opportunity to tackle first
Research That Moves the Needle
Not all research is equal. In a fast-moving startup or scale-up, you need evidence that directly informs product decisions, not generic “insights” that sit in a slide deck.
User Interviews
Aim for 5–7 interviews per target segment, enough to detect patterns without analysis paralysis.
- Screeners: Target real decision-makers or end-users, not just “anyone willing to talk.”
- Structure: Open-ended questions first, specifics later.
- Note-taking: Assign one note-taker so your interviewer can stay present.
Pro tip: Always test your understanding by summarizing the user’s point back to them before moving on.
Usability Testing
Before you build, watch users interact with competitor flows and your own low-fidelity prototypes. This uncovers usability issues before they become code-level rework.
Record time-on-task, success rate, and frustration points. If more than 30% of users stumble at the same step, you have a priority fix.
Quantitative Methods
Numbers validate scale and help prioritize:
- Event logs: Identify drop-off points in existing products.
- Cohort analysis: See how retention differs by user type or signup source.
- CAWI surveys: Keep it short, target your ICP, and use Likert scales for consistency.
Callout – Research Ops
- Consent forms & data privacy compliance (GDPR/CCPA)
- Standardized interview scripts and test plans
- Central research repository (tagged, searchable)
Prioritize Bets Like a Pro
You’ll always have more ideas than resources. The trick is picking bets with the highest impact and clearest path to proof.
RICE vs WSJF, When Each Wins
- RICE (Reach, Impact, Confidence, Effort): Works well for growth experiments, UX changes, and features with known reach metrics.
- WSJF (Weighted Shortest Job First): Ideal for backlog grooming in SAFe or when juggling compliance/regulatory deadlines.
Impact Mapping
Draw a clear line from business goal → actor → impact → deliverable. This keeps your roadmap outcome-driven.
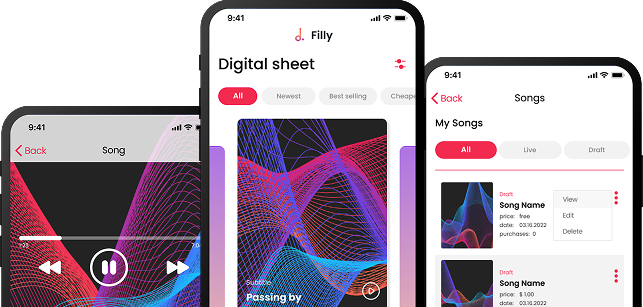
Prototyping & Experiment Design
Prototyping is where your best guesses meet reality, fast.
Clickable Prototypes
Move from low-fidelity wireframes to high-fidelity clickable prototypes to validate flows and visual hierarchy before committing to dev. Use tools like Figma or InVision for quick iteration.
Concierge MVP / Wizard-of-Oz
Manually deliver the experience behind the scenes to validate demand without building full automation. Works well for service-heavy products.
Landing Page & Smoke Tests
Launch a minimal page describing your product, track sign-ups or clicks. Set success thresholds: e.g., “50 sign-ups in 7 days” before moving forward.
.avif)
Discovery Sprint (5–10 Days)
When you need to go from problem to validated concept quickly, a discovery sprint compresses research, ideation, and testing into days instead of weeks.
Typical Agenda
- Day 0: Prep, recruit users, book slots, set metrics.
- Day 1: Align on problem & scope.
- Day 2: Explore solutions, sketch & critique.
- Day 3: Decide on the winning approach.
- Day 4: Prototype in hi-fi.
- Day 5: Test with real users, capture metrics.
Sprint Kit Checklist
- Digital boards (Miro, FigJam)
- Interview scripts & consent forms
- Pre-blocked calendar slots for test sessions
- Metrics template for time-to-task, error rates
Metrics That Prove Faster Delivery
A CTO’s product discovery process is only as good as the measurable outcomes it drives. Without metrics, it’s easy to overestimate your speed and underestimate your rework costs.
Leading Indicators
These are the early signs your discovery track is doing its job:
- Qualified interest — % of test users who would sign up or pay.
- Task success rate — How many users can complete the intended flow without help.
- Time-to-first-value (TTFV) — Minutes/hours from start to “aha” moment in the prototype.
Delivery Metrics
Once concepts pass discovery, track:
- Cycle time — From dev start to release for validated features.
- DORA metrics — Deployment frequency, change failure rate, lead time, MTTR.
- Rework rate after discovery — % of code changed or scrapped within 30 days of launch.
Governance
Keep decisions traceable:
- Maintain a decision log, capture the “why” for each choice.
- Define kill criteria upfront for experiments.
- Enforce entry/exit gates before work moves from discovery to delivery.
Artifacts & Handover (Make Delivery Frictionless)
If your discovery output is vague, engineering teams will waste cycles interpreting it. The goal: handover packages that require zero guesswork.
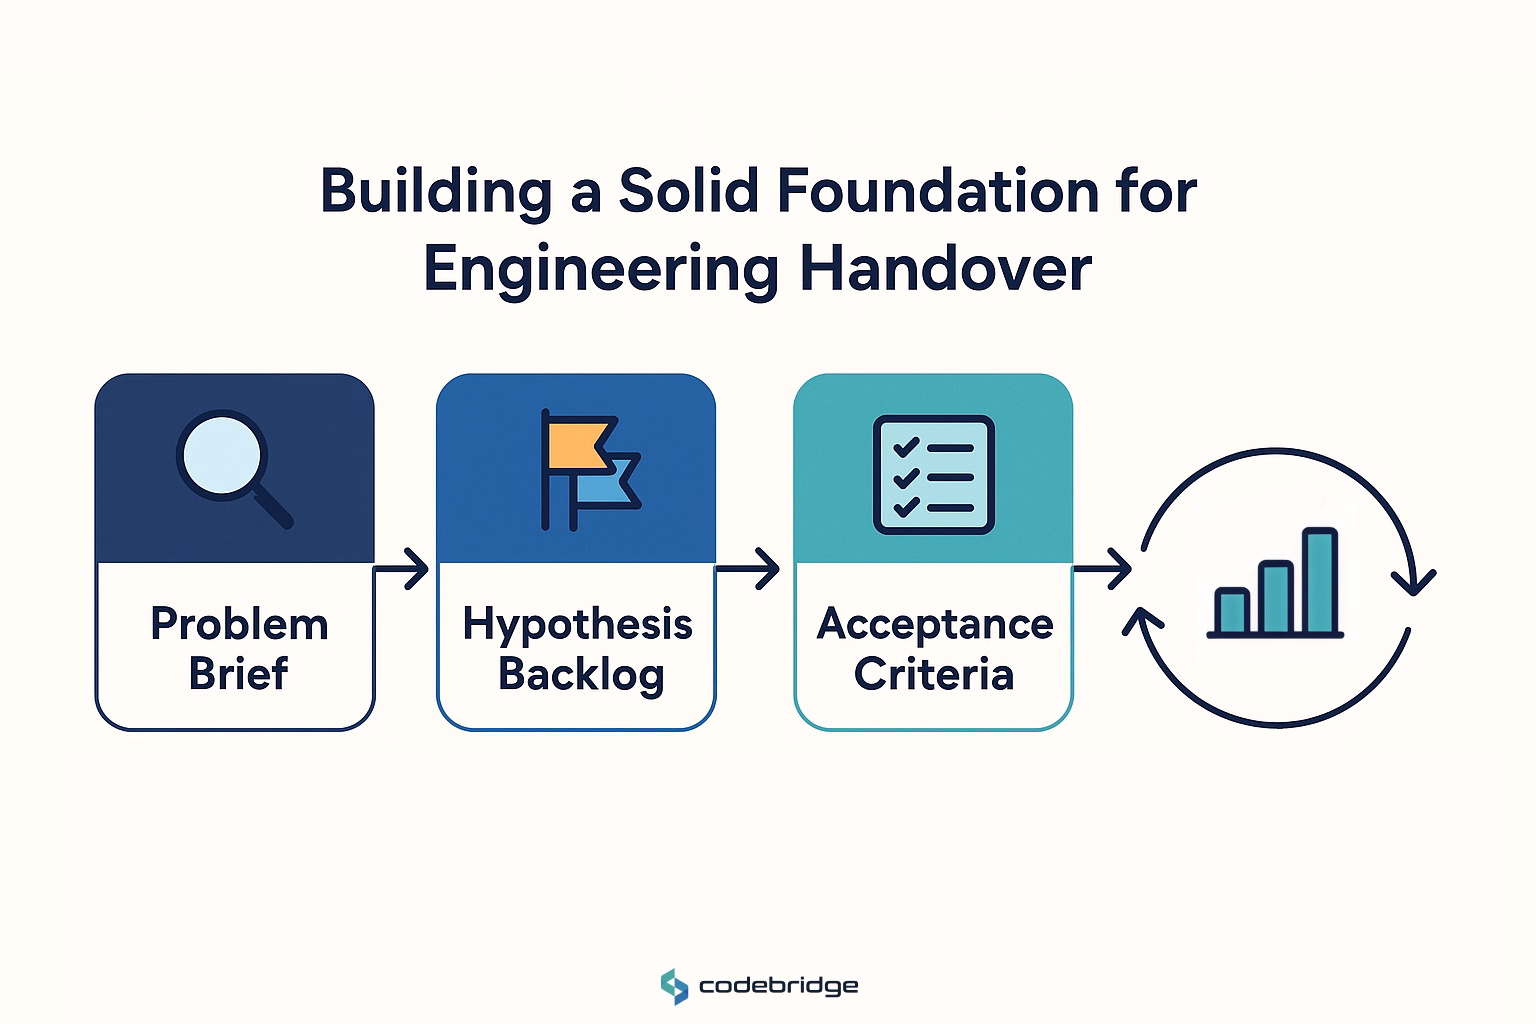
Essential Artifacts
- Problem brief — Context, constraints, desired outcomes.
- Hypothesis backlog — Sorted by priority and evidence strength.
- Acceptance criteria — Clear “done” definitions for each feature.
- Success metrics — Agreed KPIs to measure post-launch.
Delivery-Ready Extras
- PRD-lite — One-pager summarizing scope, constraints, user stories.
- Story map — Visualizing user flows across the product.
- Design tokens & component inventory — Keep dev work consistent and speed up frontend builds.
Pro tip: Use tools like Zeplin or Figma’s dev mode for one-click asset export and spec clarity.
30/60/90-Day Rollout Plan
If you’re implementing the product discovery process from scratch, stagger it for adoption and impact.
0–30 Days
- Institute weekly discovery rituals with PM/Design/Eng triad.
- Choose your prioritization and prototyping frameworks.
- Run a pilot discovery sprint on one strategic initiative.
31–60 Days
- Scale cadence to multiple squads.
- Stand up a central research repository.
- Build a metrics dashboard for TTFV, rework %, and DORA.
61–90 Days
- Create a portfolio view of all bets in discovery and delivery.
- Publish an outcome-driven roadmap tied to OKRs.
- Allocate budgets by validated opportunity size.
Common Anti-Patterns & How to Avoid Them
Even with good intentions, product discovery can go wrong in predictable ways.
- Solutioneering — jumping to features without validating the problem.
- Endless research — chasing 100% certainty instead of MVP-level confidence.
- Stakeholder derailment — no guardrails against scope creep mid-discovery.
- MVPs without learning goals — shipping with no plan to measure success or failure.
Tools & Templates
Keep your discovery practice operational and repeatable:
- Research repository — e.g., Dovetail, Airtable, Notion.
- Interview guides — ready-to-use scripts for user conversations.
- Assumption map & risk matrix — to rank uncertainty and impact.
- Prioritization spreadsheets — pre-built RICE and WSJF templates.
- Experiment tracker — logs results, evidence strength, and next steps.
- Dashboard tiles — time-to-learning, rework %, post-discovery DORA.
Conclusion
The product discovery process is your CTO-level lever to cut delivery time, reduce rework, and focus your engineering budget on features that matter. By combining clear problem framing, rapid experimentation, and disciplined handover, you turn uncertainty into evidence, and evidence into confident delivery.
Use our MVP readiness guide to align discovery with launch scope, then book a free consultation for a facilitated discovery sprint tailored to your team.
FAQ
What is the Product Discovery Process?
The Product Discovery Process is a strategic phase where teams identify user needs, define problems, and validate potential solutions before development begins. It helps ensure that your product solves real market problems, reduces waste, and aligns with business goals, leading to faster and more cost-efficient delivery.
Why is the Product Discovery Process important for CTOs?
For CTOs, the Product Discovery Process reduces technical and strategic risks early on. It allows teams to prioritize features based on real data, validate feasibility before coding, and align engineering efforts with business outcomes. This means fewer pivots, faster releases, and stronger collaboration between product and development teams.
What are the key steps in the Product Discovery Process?
The main steps of the Product Discovery Process include:
- Understanding the problem — analyzing user pain points and business context.
- Ideation and hypothesis building — brainstorming possible solutions.
- Validation and testing — using prototypes, user interviews, and feedback loops.
- Defining success metrics — ensuring every feature supports measurable outcomes.
Following these steps helps teams move from assumptions to evidence-based decisions.
How does the Product Discovery Process speed up delivery?
The Product Discovery Process speeds up delivery by identifying high-value features before development starts. Instead of building and reworking unnecessary functionality, teams focus only on validated solutions. This minimizes technical debt, accelerates time-to-market, and improves overall product quality.
How is the Product Discovery Process different from Product Delivery?
The Product Discovery Process focuses on understanding what to build, while Product Delivery focuses on how to build it. Discovery is about research, ideation, and validation, whereas delivery is about execution, engineering, and release. When integrated properly, discovery and delivery create a continuous loop of learning and improvement.
What tools or frameworks support the Product Discovery Process?
Popular tools and frameworks for the Product Discovery Process include Design Thinking, Lean Startup, and Dual-Track Agile. Teams often use tools like Miro, Figma, Productboard, or Notion for collaboration and hypothesis tracking. These resources help visualize insights, align stakeholders, and streamline decision-making.


Heading 1
Heading 2
Heading 3
Heading 4
Heading 5
Heading 6
Lorem ipsum dolor sit amet, consectetur adipiscing elit, sed do eiusmod tempor incididunt ut labore et dolore magna aliqua. Ut enim ad minim veniam, quis nostrud exercitation ullamco laboris nisi ut aliquip ex ea commodo consequat. Duis aute irure dolor in reprehenderit in voluptate velit esse cillum dolore eu fugiat nulla pariatur.
Block quote
Ordered list
- Item 1
- Item 2
- Item 3
Unordered list
- Item A
- Item B
- Item C
Bold text
Emphasis
Superscript
Subscript