Accurate software development cost estimation separates successful CTOs from those who struggle with budget overruns, missed deadlines, and stakeholder frustration. In fact, a landmark McKinsey study of over 5,400 large IT projects found that budgets over $15M suffer an average 45% cost overrun, 7% schedule overrun, and deliver just 56% of expected value, a stark reminder of how high the stakes can be. The difference isn't luck, it's mastering a systematic approach that combines technical depth with financial discipline.
This comprehensive guide provides the frameworks, methods, and real-world insights you need to estimate like a seasoned technology executive.
For expert guidance on implementing estimation frameworks in your organization, explore our web application development services.

Define Scope by Outcomes and Constraints (Time, Budget, Quality)
Professional software development cost estimation begins with clear boundaries. Instead of starting with features, define success in terms of business outcomes. What revenue impact are you targeting? How many users must the system support? What compliance requirements are non-negotiable?
Establish your project triangle upfront: time, budget, and quality constraints. Smart CTOs know that attempting to optimize all three simultaneously leads to failure. Choose your primary constraint and communicate it clearly to stakeholders.
Document your assumptions explicitly. Include technology choices, team composition, integration complexity, and performance requirements. These assumptions become your estimation foundation and change control baseline.
Inputs You Need Before Estimating (Personas, Flows, NFRs, Integrations)
Before touching a calculator, gather these essential inputs:
.avif)
- User personas and workflows define complexity multipliers. A system serving internal employees has different architectural requirements than one handling millions of external customers. Map critical user journeys to understand data flow, error handling, and performance bottlenecks.
- Non-functional requirements (NFRs) drive 40-60% of development effort. System availability, response times, security standards, and compliance needs fundamentally shape architecture decisions. A 99.9% uptime requirement costs dramatically more than 95% availability.
- Integration landscape assessment prevents nasty surprises. Catalog existing systems, APIs, data sources, and third-party services. Each integration point adds complexity, testing burden, and potential failure modes.
Capacity Model (Holidays, Ramp, Ceremonies, QA/Dev Ratio)
Build realistic capacity models that account for human factors:
Available development hours rarely exceed 6 per 8-hour day. Factor in meetings, code reviews, debugging, and context switching. Senior developers spend 30-40% of time mentoring and architectural decision-making.
Team ramp-up time varies by project complexity. New team members reach 50% productivity in 2-4 weeks, full productivity in 8-12 weeks. Plan accordingly when scaling teams mid-project.
QA-to-development ratios typically range from 1:3 to 1:5, depending on quality requirements. Mission-critical systems need higher QA investment. Include dedicated test environment costs and automation framework development time.
Cost Drivers You Can Actually Control
Scope definition represents your biggest cost lever. MVPs typically cost 50-70% less than full v1 releases by focusing on core value propositions. Resist feature creep by maintaining a ruthless focus on user outcomes.
Integration complexity scales exponentially. Each additional system integration increases testing combinations, error scenarios, and operational monitoring requirements. Budget 20-30% extra effort per major integration beyond the first three.
Data architecture decisions have lasting cost implications. Simple CRUD operations cost dramatically less than real-time analytics, complex reporting, or machine learning pipelines. Choose data patterns that match your actual requirements, not aspirational ones.
Service Level Objectives (SLOs) drive infrastructure and operational costs. Moving from 99% to 99.9% availability often doubles operational complexity. Define SLOs based on business impact, not technical ego.
Team Composition & Seniority Mix; Parallelism vs Coordination Tax
Seniority distribution affects both cost and velocity. All-senior teams cost more but deliver faster with fewer defects. Mixed teams require more coordination overhead but offer cost advantages for well-defined work.
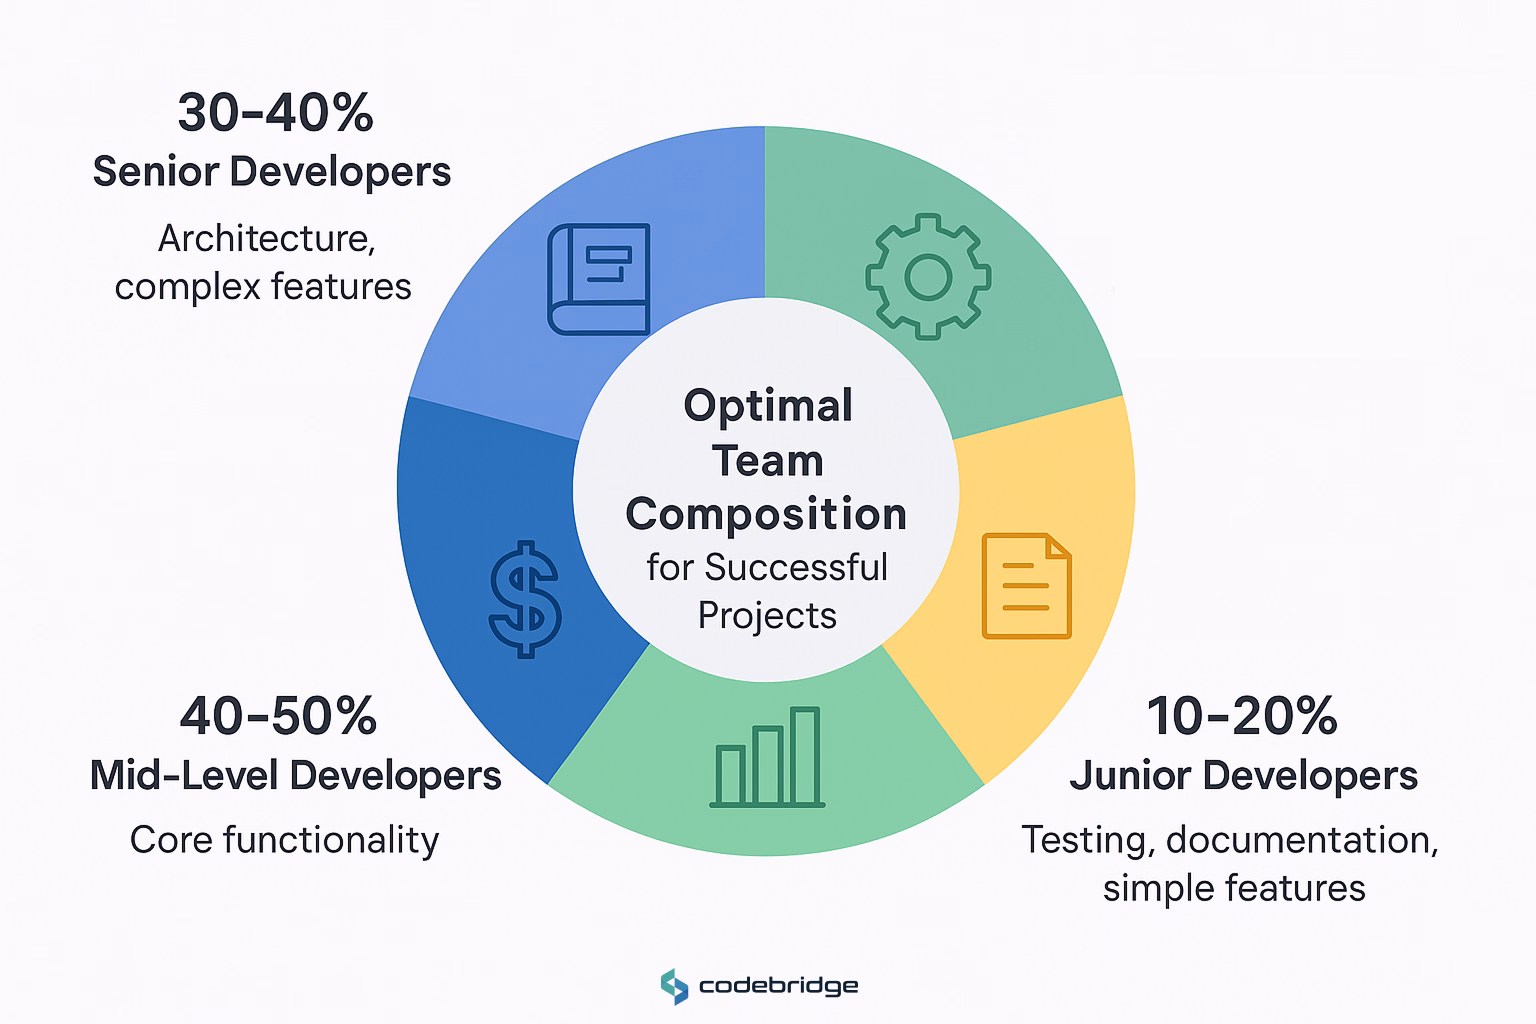
Optimal team composition for most projects:
- 30-40% senior developers (architecture, complex features)
- 40-50% mid-level developers (core functionality)
- 10-20% junior developers (testing, documentation, simple features)
Coordination overhead grows quadratically with team size. Teams larger than 8-10 people need explicit coordination mechanisms: architecture documents, API contracts, and integration testing strategies.
Parallel development requires upfront architectural investment. Without clear module boundaries, teams block each other, reducing overall velocity despite higher costs.
Codebase & Platform Realities (Greenfield, Replatform, Legacy Refactor)
Greenfield projects offer maximum flexibility but require all infrastructure decisions. Budget 15-25% extra time for tooling setup, CI/CD pipeline configuration, and operational procedures.
Legacy system integration typically costs 2-3x initial estimates due to technical debt, documentation gaps, and unexpected dependencies. Plan discovery phases to surface integration challenges early.
Replatforming efforts combine the worst aspects of greenfield and legacy work. Budget 40-60% overhead for data migration, feature parity validation, and dual-system operational complexity.
Software Development Cost Estimation Methods
Top-down estimation starts with overall project scope and allocates effort across major components. Use this for early planning and sanity checks.
Based on historical data, web applications typically cost $50-150 per function point or $100-300 per user story.
Bottom-up estimation builds detailed work breakdown structures and sums component estimates. More accurate but time-intensive. Reserve for projects with well-defined requirements and experienced teams.
Delta reconciliation reveals estimation blind spots. When top-down and bottom-up estimates differ by more than 25%, investigate the assumptions. Common gaps include integration testing, documentation, deployment automation, and operational setup.
Analogous vs Parametric
Analogous estimation leverages similar past projects to predict current efforts. Effective when you have comparable projects in scope, technology, and team composition. Adjust for differences in complexity, team experience, and requirement clarity.
Parametric models use mathematical relationships between project characteristics and effort. Function Points, COSMIC, and COCOMO II provide structured approaches for organizations with sufficient historical data.
Track your team's throughput metrics: velocity (story points per sprint), cycle time (feature start to completion), and defect rates. These become your parametric baseline for future estimates.
Function Points / COSMIC / COCOMO II (When Formal Methods Help)
Function Point Analysis measures software functionality independent of technology. Useful for business applications with clear data inputs, outputs, and logical files. Requires training but provides vendor-neutral sizing metrics.
COSMIC method works better for real-time systems, embedded software, and modern architectures. Measures data movements across software boundaries. ISO standard approach is gaining adoption in complex system environments.
COCOMO II combines size estimates with adjustment factors for team experience, tool maturity, and project complexity. Most effective for organizations with extensive project databases and consistent development processes.
Use formal methods when:
- Contracting with external vendors
- Building similar systems repeatedly
- Regulatory compliance requires audit trails
- Historical data supports model calibration
Story Points → Hours → Dollars (Guardrails; Don't Overfit)
Story point conversion varies significantly by team and context. Establish team-specific conversion factors based on historical performance: 1 story point = 4-8 hours for most teams.
Conversion stability requires consistent team composition and estimation practices. Major team changes reset your baseline. Don't force artificial consistency across different teams or projects.
Dollar conversion multiplies hours by blended team rates. Include fully-loaded costs: salary, benefits, overhead, tools, and workspace. Typical multipliers range from 1.8x to 2.5x base salary rates.
Fixed Price vs Time and Materials
Fixed price contracts shift delivery risk to vendors but reduce flexibility. Appropriate when requirements are stable, the scope is well-defined, and you have experience with similar projects. Vendors typically add 20-40% contingency to fixed-price bids.
Time and materials preserves flexibility but requires active management. Better for exploratory work, evolving requirements, or complex integration projects. Include not-to-exceed clauses to maintain budget discipline.
Risk allocation affects both pricing and outcomes. Fixed price may seem safer, but often leads to corner-cutting when vendors encounter unexpected complexity. T&M requires more oversight but enables quality optimization.
Dedicated Team & Milestones
Dedicated team models provide maximum control and flexibility. Teams focus exclusively on your project, enabling deep domain knowledge and fast iteration. Monthly costs range from $25,000-60,000 for 4-6 person teams, depending on location and seniority.
Milestone-based payments balance risk and cash flow. Structure milestones around demonstrable business value, not just feature completion. Include criteria for milestone acceptance and change procedures.
Governance frameworks prevent scope creep and maintain quality. Establish weekly demos, monthly business reviews, and quarterly architectural assessments. Clear escalation procedures handle conflicts before they derail projects.
Build the Estimate
Work Breakdown Structure decomposes projects into manageable chunks. Structure around business capabilities, not technical layers. Each work package should deliver independently testable value.
Three-point estimation captures uncertainty explicitly. For each component, estimate:
- Optimistic: Everything goes perfectly (10% probability)
- Most likely: Typical execution with normal challenges
- Pessimistic: Major obstacles but still achievable (10% probability)
PERT formula converts three-point estimates into expected values: (Optimistic + 4×Most Likely + Pessimistic) ÷ 6. This provides more realistic estimates than single-point approaches.
.avif)
Non-build Line Items (PM, QA, DevOps, Security, Design, UXR, Licenses)
Project management typically represents 10-15% of total effort. Include sprint planning, stakeholder coordination, risk management, and vendor oversight. Complex projects with multiple stakeholders require higher PM investment.
Quality assurance scales with system complexity and user criticality. Budget 20-30% of development effort for testing activities: functional testing, performance validation, security assessment, and user acceptance testing.
DevOps infrastructure enables reliable delivery but requires upfront investment. Include CI/CD pipeline setup, environment provisioning, monitoring configuration, and deployment automation. Typically 5-10% of project cost.
Security assessment requirements vary by industry and data sensitivity. HIPAA, PCI-DSS, and SOC 2 compliance add 15-25% to development costs through additional architecture, testing, and documentation requirements.
Licensing costs compound over time. Include development tools, cloud services, third-party components, and production runtime licenses. SaaS tools typically cost $50-200 per developer per month.
Risk, Uncertainty & Buffers
Cone of Uncertainty demonstrates that estimation accuracy improves as project details emerge. Initial estimates have ±75% variance, narrowing to ±25% by requirements completion and ±10% by design finalization.
Discovery sprints reduce uncertainty faster than traditional analysis. Spend 2-4 weeks building proof-of-concept implementations for high-risk technical decisions. This investment typically prevents 5-10x larger problems during development.
Progressive estimation updates forecasts as uncertainty decreases. Re-estimate at major project milestones, not just when problems surface. Stakeholder communication improves when they understand estimation evolution.
Contingency Budget (10–30% Based on Risk Profile)
Contingency allocation depends on project risk factors:
- Low risk (known technology, experienced team, stable requirements): 10-15%
- Medium risk (some new technology or team members): 15-20%
- High risk (new technology, new team, evolving requirements): 20-30%
Risk-based contingency allocates buffers where they're needed most. Technical integration challenges typically require higher contingency than feature development. Budget extra time for first-of-kind implementations.
Contingency governance prevents buffer abuse. Establish clear criteria for contingency use and approval processes. Track contingency consumption to improve future estimation models.
Monte Carlo Estimation for Schedule/Cost Confidence Intervals
Monte Carlo simulation provides probabilistic forecasts instead of point estimates. Model task durations as probability distributions based on historical data and current uncertainty levels.
Confidence intervals communicate risk more effectively than single numbers. Report 50%, 80%, and 90% confidence levels: "There's an 80% chance the project completes within $450K-650K and 16-22 weeks."
Simulation tools automate complex calculations. Specialized software handles task dependencies, resource constraints, and correlation effects. Results guide both estimation and risk mitigation planning.
Build vs Run, From Capex to TCO
Cloud Baseline (Envs, Data Transfer, Storage, Observability)
Environment costs multiply beyond production systems. Budget for development, staging, testing, and disaster recovery environments. Each environment typically costs 20-40% of production infrastructure.
Data transfer charges accumulate with usage growth. Cross-region replication, CDN distribution, and API integrations generate ongoing egress fees. Monitor data patterns early to avoid billing surprises.
Storage costs grow with data retention requirements. Include database storage, file assets, log retention, and backup requirements. Implement lifecycle policies to manage long-term growth.
Observability infrastructure enables reliable operations. APM tools, log aggregation, metric collection, and alerting systems typically cost $50-200 per server per month but prevent much larger outage costs.
QA Environments, Device Labs, CI/CD Minutes, Security Scans
QA environment provisioning supports parallel testing activities. Include device farms for mobile testing, browser compatibility labs, and load testing infrastructure. Budget $5,000-20,000 for comprehensive testing capabilities.
CI/CD pipeline costs scale with team size and build frequency. GitHub Actions, Azure DevOps, and Jenkins hosting require compute resources for automated testing and deployment. Plan for 100-500 build minutes per developer per month.
Security scanning tools identify vulnerabilities before production. Static analysis, dependency scanning, and runtime security monitoring typically cost $20-100 per developer per month but prevent potentially devastating breaches.
Support & Maintenance (Bug-fix Window, Patch Cadence, Roadmap)
Maintenance costs typically represent 15-25% of initial development investment annually. Include bug fixes, security patches, dependency updates, and minor feature enhancements.
Support SLA commitments drive staffing and infrastructure requirements. 24/7 support costs significantly more than business hours only. Define support levels based on business criticality, not technical preferences.
Technology refresh cycles require periodic major updates. Budget for framework upgrades, database migrations, and security compliance updates every 2-3 years. These aren't optional; they prevent technical debt accumulation.
Web Application Development Cost, MVP (Single Platform, 3–5 Core Flows)
MVP scope focuses ruthlessly on core value proposition. Include user authentication, 3-5 primary user workflows, basic reporting, and essential integrations. Resist feature expansion that doesn't directly validate business hypotheses.
Team composition for MVP projects typically includes 1 senior developer, 1-2 mid-level developers, 1 designer, and 1 part-time PM. Total team cost ranges $40,000-80,000 per month, depending on location and seniority mix.
Timeline and budget for web application MVPs range 2-4 months and $50,000-150,000. Include deployment infrastructure, basic monitoring, and post-launch support. Plan an additional 30% budget for user feedback incorporation.
v1 Scale-up (RBAC, Analytics, Payments, SSO)
v1 enhancement scope adds enterprise-ready features. Role-based access control, comprehensive analytics, payment processing, and single sign-on integration represent the most common scale-up requirements.
Complexity multipliers increase with each enterprise feature. RBAC adds 40-60% to development time through permission modeling, UI updates, and testing scenarios. Payment integration requires PCI compliance and extensive error handling.
Budget expectations for v1 scale-up range $150,000-400,000, depending on feature complexity. Timeline extends 4-8 months with larger teams (5-8 people). Include security assessments and performance testing in estimates.
Enterprise (Compliance, SSO/SAML, Audits, Performance SLOs)
Enterprise requirements emphasize governance, security, and operational excellence. SOC 2 compliance, SAML integration, audit logging, and strict performance SLOs represent typical enterprise needs.
Compliance overhead adds 25-40% to development effort through documentation, testing, and review procedures. Security requirements often dictate architectural decisions that increase complexity across all system components.
Enterprise project budgets typically range $400,000-1,500,000 with 8-15 person teams over 8-18 months. Include ongoing compliance monitoring, security assessments, and dedicated infrastructure in TCO calculations.
Rate Bands by Role; Overlap Hours; Comms & Quality Considerations
Regional rate variations significantly impact project economics:
North America: $100-200/hour for senior developers, $60-120 for mid-level
Western Europe: $80-150/hour senior, $50-100 mid-level
Eastern Europe: $40-80/hour senior, $25-60 mid-level
Latin America: $45-75/hour senior, $30-55 mid-level
Asia: $25-60/hour senior, $15-40 mid-level
Time zone overlap affects collaboration effectiveness. 4+ overlapping hours enable real-time communication. Fewer overlapping hours require more asynchronous processes and documentation discipline.
Communication quality varies by cultural and linguistic factors. Native English speakers reduce miscommunication risks but cost more. Invest in clear requirements documentation and regular video conferences for offshore teams.
Seniority Mix & Productivity; When to Pay for Seniors vs Scale Juniors
Senior developer productivity typically exceeds junior developers by 3-5x on complex tasks. Architecture decisions, system design, and debugging benefit dramatically from experience. False economy to use junior resources for critical technical decisions.
Junior developer optimization works well for well-defined, low-complexity work. Code implementation from detailed specs, testing execution, and documentation creation offer good junior developer value. Provide appropriate mentorship and code review.
Blended team strategies balance cost and capability. Use senior developers for architecture and complex features, mid-level for core implementation, juniors for testing and support. Maintain:
1 senior
2-3 mid-level
1-2 junior ratios for most projects
Benchmarks & Sanity Checks
Velocity Ranges by Team Maturity; PR Size & Review Turnaround
Team velocity benchmarks provide sanity check mechanisms:
- New teams: 15-25 story points per 2-week sprint
- Established teams: 25-40 story points per 2-week sprint
- High-performing teams: 40-60 story points per 2-week sprint
Code review metrics indicate team health. PR size should average <400 lines of code changes. Review turnaround should be <24 hours for most changes. Longer cycles indicate process or resource bottlenecks.
DORA metrics benchmark delivery performance:
- Elite teams: Daily deployments, <1 hour recovery, <15% change failure rate
- High performers: Weekly deployments, <1 day recovery, 16-30% change failure rate
- Medium performers: Monthly deployments, <1 week recovery, 16-30% change failure rate
Feature cost benchmarks vary by complexity:
- Simple CRUD feature: $5,000-15,000
- Complex workflow: $15,000-50,000
- Integration feature: $20,000-75,000
- Reporting/analytics: $25,000-100,000
Unit economics help validate estimates. Calculate cost per supported user, transaction, or business outcome. Compare against industry benchmarks and revenue models to ensure economic viability.
Sanity check calculations: If your estimates suggest >$1,000 per supported user for a standard business application, investigate assumptions. Most web applications should support users at $100-500 per user, including development and first-year operations.
30/60/90-Day Estimation & Planning Plan
0–30: Discovery, Assumptions Log, ROM Estimate, Risk Register
Discovery phase activities reduce estimation uncertainty:
- Stakeholder interviews and requirement validation
- Technical architecture evaluation and proof-of-concepts
- Integration complexity assessment and vendor evaluation
- Team composition planning and skill gap analysis
Rough Order of Magnitude (ROM) estimates provide initial budget guidance. Use analogous estimation and high-level parametric models. Accept ±50% accuracy at this stage while surfacing major cost drivers and constraints.
Risk register creation identifies potential project challenges early. Catalog technical risks, resource risks, external dependencies, and requirement volatility. Prioritize risks by probability and impact for mitigation planning.
31–60: Prototypes, Bottom-up Estimate, Vendor Quotes, Commit Coverage
Prototype development validates technical assumptions and reduces integration risks. Build working demonstrations of high-risk technical decisions: complex algorithms, third-party integrations, performance requirements, and user experience concepts.
Bottom-up estimation provides detailed work breakdown and effort allocation. Create comprehensive user story mapping, technical task identification, and resource assignment. Reconcile with top-down estimates to identify gaps.
Vendor evaluation and quotation collection establishes market benchmarks. Even for internal projects, understand external pricing to validate internal estimates. Include implementation, training, and support costs in vendor comparisons.
61–90: Finalize SOW, Contingency, Success Metrics, Kickoff
Statement of Work finalization documents scope, timeline, and budget commitments. Include clear acceptance criteria, change control procedures, and communication protocols. Align technical deliverables with business outcomes.
Contingency allocation and risk mitigation planning prepare for uncertainty. Assign specific contingency budgets to identified risks. Create mitigation plans for high-probability/high-impact scenarios.
Success metrics definition enables project tracking and stakeholder alignment. Include both technical metrics (performance, quality, delivery) and business metrics (user adoption, revenue impact, cost savings).
Executive Dashboard, Keep Cost & Value Honest
Budget tracking tiles provide real-time financial visibility:
- Actual vs. planned spend with trend projections
- Burn rate analysis and runway calculations
- Cost per story point or function point trends
- Contingency utilization and remaining buffer
Scope change monitoring prevents uncontrolled expansion:
- Original vs. current story point totals
- Change request volume and approval rates
- Scope creep impact on timeline and budget
- Stakeholder change request patterns
Velocity and quality metrics balance speed with sustainability:
- Team velocity trends and capacity utilization
- DORA metrics: deployment frequency, change failure rate, recovery time
- Defect discovery rates and resolution times
- Technical debt accumulation and remediation
Alerts: Risk Burndown, Contingency Draw, Cloud $/Request
Risk management alerts provide early warning systems:
- High-priority risks approaching trigger dates
- Risk mitigation activities behind schedule
- New risks identified above threshold severity
- Risk contingency budget consumption rates
Financial threshold alerts prevent budget overruns:
- Monthly burn rate exceeding plan by >10%
- Contingency consumption >50% without milestone completion
- Cloud infrastructure costs >20% above projections
- Team utilization <70% or >90% for multiple weeks
Performance degradation alerts identify delivery risks:
- Velocity declining >15% for 2+ sprints
- Code review turnaround time >48 hours
- Change failure rate above team baseline
- Customer-reported defect rates increasing
Conclusion
Successful software development cost estimation combines systematic methodology with practical experience. The frameworks outlined here provide structure, but expertise comes from consistent application and continuous improvement.
Key takeaways for immediate implementation:
- Start every estimate with clear outcome definitions and constraint priorities
- Use both top-down and bottom-up methods, reconciling differences to surface blind spots
- Account for the full cost of delivery: development, infrastructure, operations, and maintenance
- Build realistic capacity models that consider human factors and team dynamics
- Establish risk-appropriate contingency budgets with clear governance procedures
Transform your estimation practice from guesswork to systematic discipline. Your stakeholders, team, and financial results will reflect the difference. Book a free consultation to discuss your specific project requirements. Together, we'll develop estimation practices that drive consistent delivery success.
FAQ
Do you have a software development cost estimation template I can follow?
Yes, start with outcomes and constraints (time/budget/quality), assumptions (tech stack, team mix, integrations, NFRs), and a capacity model (realistic dev hours, ramp-up, QA:Dev 1:3–1:5). Add a Work Breakdown Structure (business-value slices), three-point estimates per work item, contingency (10–30% by risk), and governance (milestones, change control, SLAs).
Which software project estimation techniques are most reliable?
Use top-down (sanity check via analogs/benchmarks) + bottom-up (detailed WBS) and reconcile deltas >25%. Layer in analogous (past similar builds) and parametric methods (Function Points, COSMIC, COCOMO II) once you have baselines. Track velocity, cycle time, and defect rates to calibrate future estimates.
What’s a realistic MVP app development cost estimate and timeline?
For a single-platform MVP (auth + 3–5 core flows + essentials), expect $50k–$150k over 2–4 months with a lean team (1 senior, 1–2 mid, designer, part-time PM). Plan ~30% extra for post-launch feedback and include CI/CD, monitoring, and basic Ops from day one.
When should I choose function point vs COCOMO II for sizing?
Use Function Points for business apps with clear inputs/outputs; COSMIC for real-time/embedded/modern boundary-heavy systems; COCOMO II when you can model size plus drivers like team experience, tool maturity, and complexity. All three benefit from historical calibration and are ideal for vendor contracts or regulated environments.
How do I run a Monte Carlo software project estimation to set confidence ranges?
Model each task with optimistic/most-likely/pessimistic durations (PERT), simulate thousands of runs, then report P50/P80/P90 windows (e.g., “80% chance to finish in 16–22 weeks and $450k–$650k”). Use results to size contingency, stage gates, and risk burndown plans.


Heading 1
Heading 2
Heading 3
Heading 4
Heading 5
Heading 6
Lorem ipsum dolor sit amet, consectetur adipiscing elit, sed do eiusmod tempor incididunt ut labore et dolore magna aliqua. Ut enim ad minim veniam, quis nostrud exercitation ullamco laboris nisi ut aliquip ex ea commodo consequat. Duis aute irure dolor in reprehenderit in voluptate velit esse cillum dolore eu fugiat nulla pariatur.
Block quote
Ordered list
- Item 1
- Item 2
- Item 3
Unordered list
- Item A
- Item B
- Item C
Bold text
Emphasis
Superscript
Subscript