Unlock Your Holiday Savings
Build your SaaS faster and save for the next 3 months. Our limited holiday offer is now live.
Explore the Offer
Valid for a limited time


A multi-site distribution operator runs 100+ warehouses and depots, with a roadmap past 500 sites. They needed continuous stock visibility between periodic cycle counts. We built a camera-driven view of what is physically on the racks and on the floor, and how big it is, reconciled against the WMS in near real time.
The hard part was metrology, not detection. Turning pixels into centimetres with a defensible error bar, on a moving floor, with non-ideal lighting. Three hard constraints shaped the work: raw video could not leave the site, depot-to-centre links were uneven, and the system could not slow the people working the floor.
Client identity, geography, vendor names and exact figures have been generalised at the client's request. The architecture, measurement approach and deployment model described are as delivered.
Before the engagement, stock visibility ran on a familiar playbook: cycle counts on a schedule, barcode scans at receiving and putaway, and a WMS that treated those inputs as the source of truth. At smaller scale it held up. At the operator's scale, with the expansion roadmap pushing the estate further every quarter, the same approach started accumulating blind spots faster than the operations team could close them.
Between counts, the operator was blind:
The net effect at scale: overstated system stock, avoidable stockouts at the pick-face, wasted picker travel, bad cube data flowing into bad slotting and bad load plans.
Add a continuous, camera-driven view that becomes the primary signal between cycle counts. Counts and barcode scans stay as inputs, no longer as the only stock-truth signal. The view covers presence (what is on each rack right now), quantity (count and fill-state per location), dimensions (length, width, height and volume of inbound goods, measured rather than keyed), and reconciliation against the WMS in near real time.
Constraint 1. Raw video cannot leave the site. Site-level privacy and contractual obligations meant footage could not be backhauled to a central cloud. Only derived measurements and events could egress.
Constraint 2. Depot-to-centre links are uneven. Bandwidth and reliability varied across the estate. The system had to operate, and keep measuring, through degraded links and full disconnections, with no central blind spots when connectivity returned.
Constraint 3. The system cannot slow the floor. Pickers, putaway and receiving could not be asked to pose for the camera, stop to confirm a measurement, or scan extra barcodes. Capture had to be passive and in-flow, with no added cycle time.
Standard warehouse computer-vision projects stop at "is there something on the rack?" That is a classification or detection task. The brief here required two further steps that most teams under-estimate.
1. Localise (computer vision)
Find the object in the frame and segment it from background, neighbouring SKUs, packaging and shelf furniture.
2. Measure (metrology)
Recover real-world dimensions (length, width, height, volume) from imagery, with a known accuracy budget, on a moving floor with non-ideal lighting.
3. Reconcile (systems)
Fuse those measurements against WMS state, raise variances, and route them to the right human in near real time.
Step 2 is the hard part. Pixels are not centimetres. Turning them into centimetres with a defensible error bar is a metrology problem built on top of computer vision. That discipline separates a useful warehouse-vision system from a slideware demo.
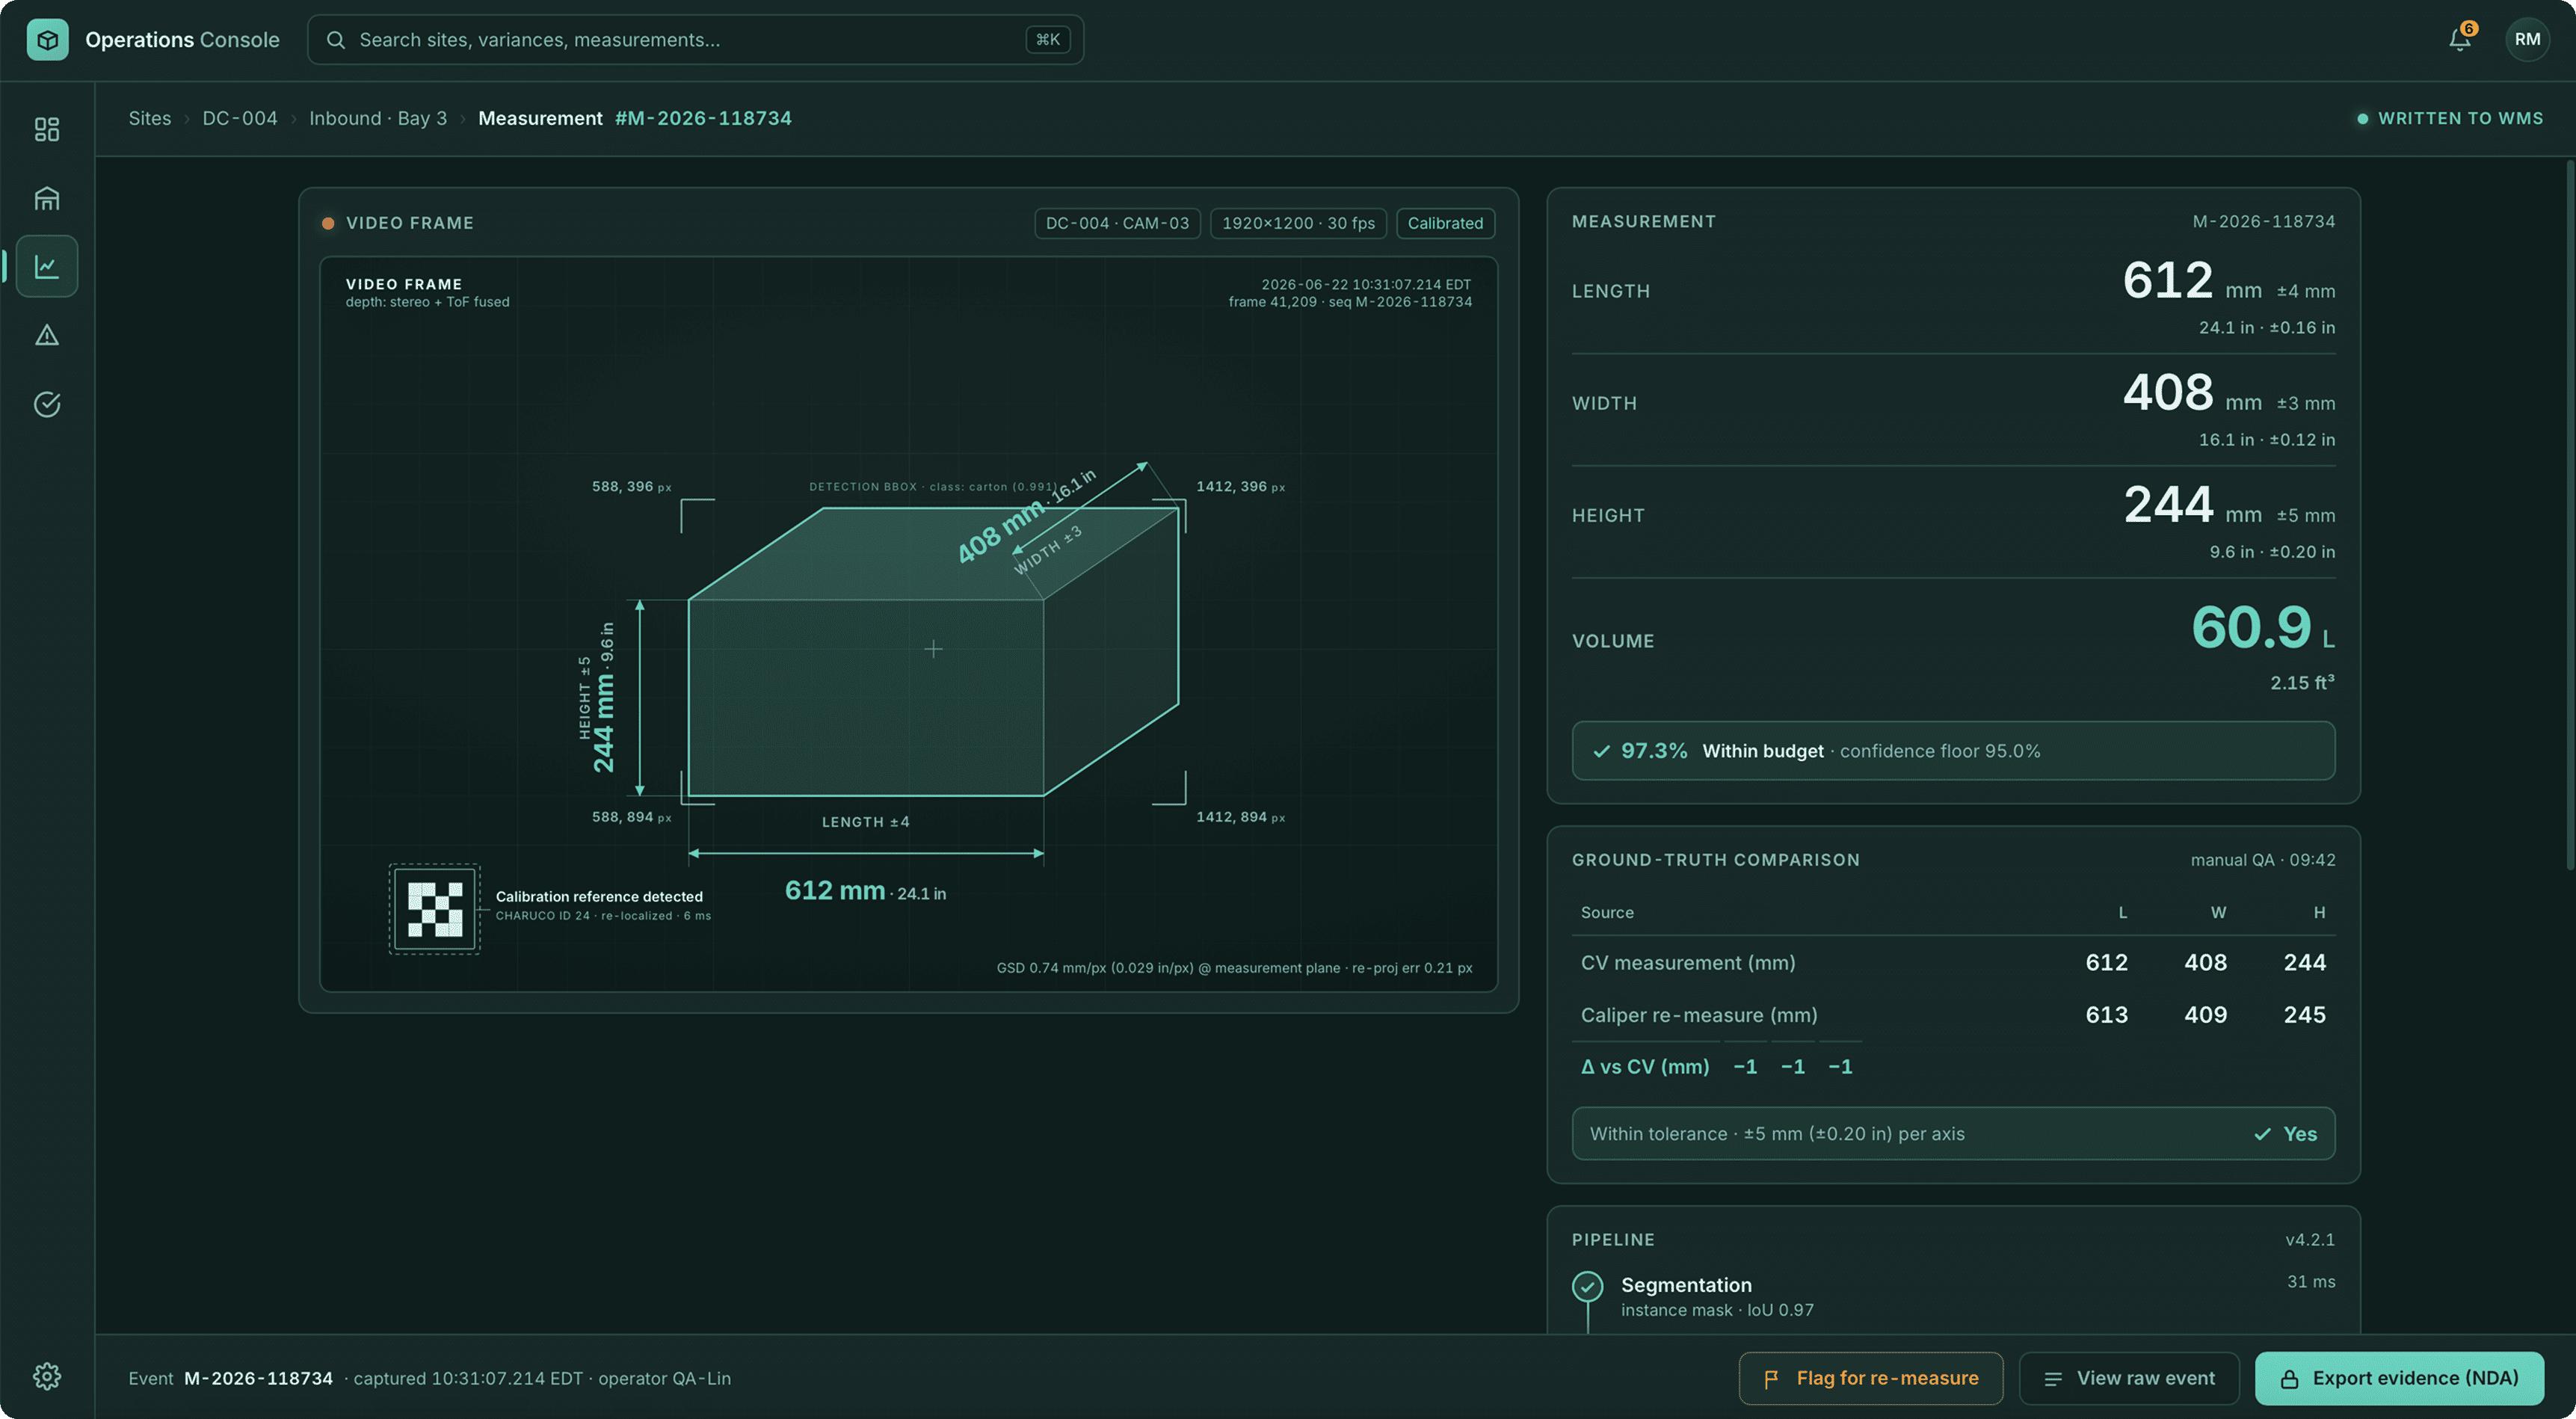
We calibrate each camera against a known scene geometry: fiducial markers placed at receiving and pick-faces, plus reference objects of known dimension already present in the workflow (totes, pallet footprints, shelf beams). Calibration removes lens distortion, recovers intrinsics, and locks the pixel-to-millimetre relationship at the depth ranges the camera sees. Drift detection triggers re-calibration on its own. A site does not stop work to recalibrate.
A segmentation model isolates the object of interest (a carton, parcel, tote or pallet load) from its background. We use instance segmentation rather than bounding boxes because dimensioning requires silhouettes, not rectangles. A tilted carton would otherwise inflate its measured length by several centimetres.
Where stereo or depth-capable cameras exist, depth comes from the sensor. Where the existing CCTV is monocular (the common case across the estate), we recover depth from three signals: the calibrated ground plane, reference objects in-frame at known scale, and multi-view fusion when an object passes more than one camera. We then derive length, width and height from the segmented silhouette under the calibrated geometry. Volume follows from those dimensions for cuboidal items, and from the recovered volumetric model for non-cuboidal loads.
Every measurement carries a confidence envelope, not a bare number. Below a per-SKU-class threshold, the system flags the measurement as advisory and asks for confirmation. It does not push low-confidence cubes into the WMS without review. In a production measurement system, an honest "I'm not sure" beats a confident wrong answer.
On a schedule, we match a sample of measurements against physical re-measurement (calipers or a certified cubing station), and against the manufacturer-declared cube where available. The deltas feed model retraining and per-site error budgets. We track accuracy, not assume it.
Why this matters for any measurement-from-imagery project. Defensible dimensional accuracy from imagery (sub-centimetre on warehouse cartons in this engagement, with tighter error budgets achievable in regimes with simpler scene geometry) does not come from picking a better model. It comes from disciplined calibration, segmentation quality, depth recovery, and honest confidence reporting.
A dedicated on-site processing unit at each depot runs all CV inference locally. Only structured measurements and events leave the site, never raw video. This section describes the on-prem multi-site delivery surface required by this engagement. The CV and metrology pipeline above is the transferable part of the work.
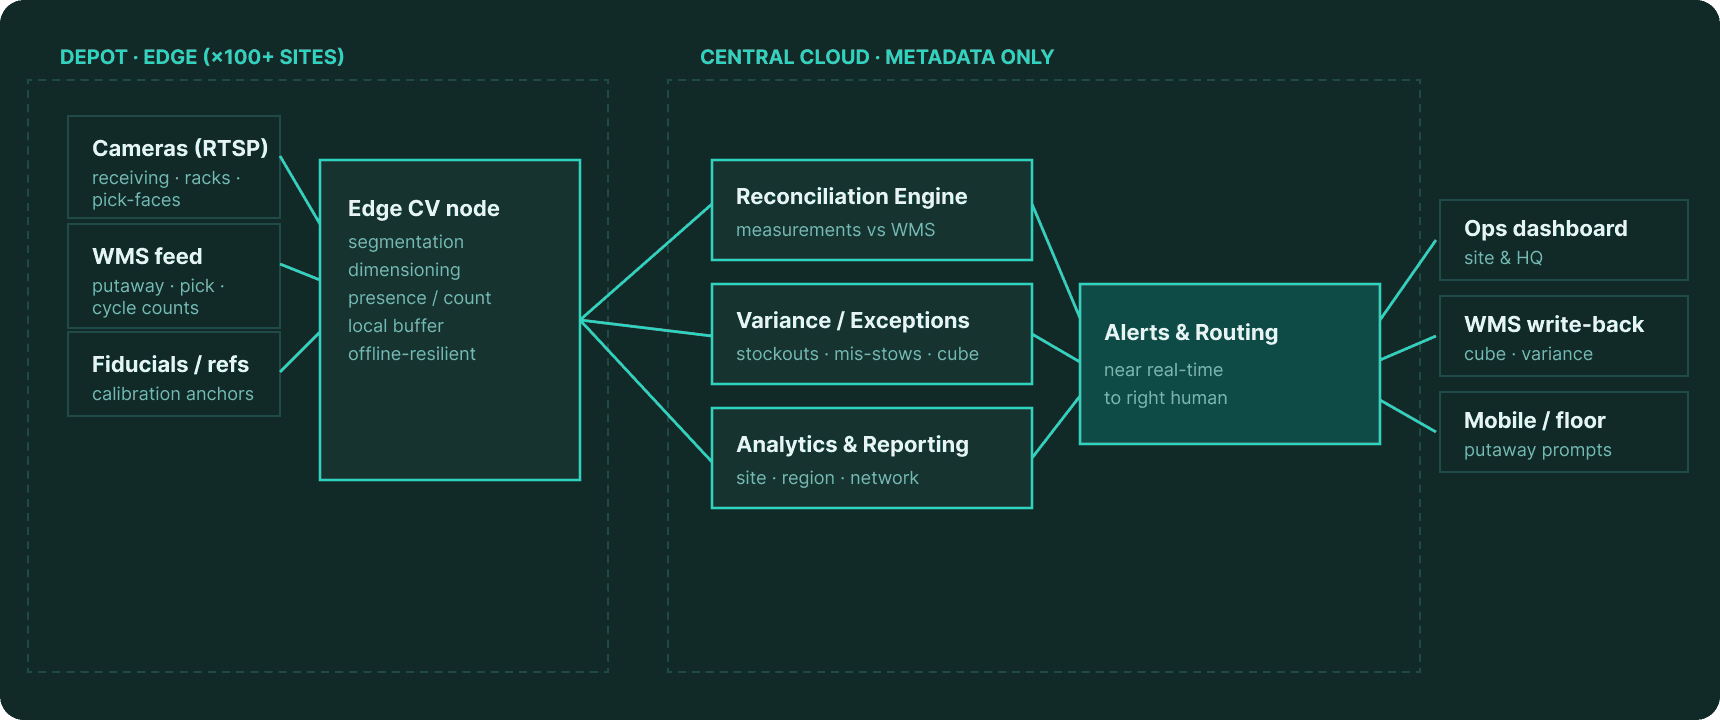
Every technology choice was driven by three criteria: defensible measurement accuracy at production scale, edge-first operation that respects on-site data constraints, and portability across cloud providers without vendor lock-in.
CV measurement at depot → structured event to centre → match against WMS → variance routed to the right human.
Measured against the operator's own pre-deployment baseline at the pilot sites, and tracked at each rollout wave:
Specific percentage figures are withheld at the client's request.
The class of problem solved here: recover a real-world measurement of a physical object from imagery, with a known accuracy budget, at production scale, on mostly existing hardware, with targeted additions only where the geometry requires them. The same class shows up across different industries:
The CV and metrology disciplines that transfer are calibration, segmentation quality, depth recovery, multi-view fusion, honest confidence reporting, and ground-truth validation loops. They are independent of the delivery surface.
The delivery surface itself adapts to the constraint set. In this engagement that meant edge nodes plus central cloud, because raw video could not leave the premises. For consumer-facing sizing on a brand's e-commerce site the constraint set inverts: there are no premises and no fleet of edge nodes, so the pipeline runs server-side behind a cloud API, fronted by an embeddable widget on the brand's own surface. Same five-layer metrology pipeline, different delivery surface.
The reference object that anchors scale also shifts with the regime. In this engagement, reference objects (pallets, totes, fiducial markers) are already in the scene by virtue of the workflow. In a consumer setting they aren't, so scale is anchored on a user-presented object of known dimension (a payment card or printed marker held alongside the object), on the device's own AR-derived scene scale, or on an anatomical prior calibrated against a held reference. Different references, same calibration discipline.
Accuracy is tracked, not assumed. Every measurement leaves the pipeline with a confidence envelope, and a sampled subset feeds a closed-loop validation harness against physical re-measurement using calipers or a certified cubing station.
Three feedback loops run in parallel. Scheduled ground-truth comparison drives per-site error budgets and model retraining. Per-camera drift detection monitors calibration against known scene geometry and fires automated re-calibration when the pixel-to-millimetre relationship moves beyond threshold. Below a per-SKU-class confidence threshold, the system flags the measurement as advisory and asks for one-tap human confirmation rather than writing it back to the WMS.
The discipline matters more than the model architecture. Sub-centimetre accuracy on warehouse cartons in this engagement came from calibration quality, segmentation rigour, and honest confidence reporting.
Three constraints made edge-first the only viable choice for this engagement.
Privacy and contract. Raw footage from the warehouse floor could not leave the site. Backhauling video to a central cloud would have violated client policy and the underlying tenant agreements at several depots.
Bandwidth and link reliability. Depot-to-centre connectivity varied widely. Streaming hundreds of camera feeds per site over uneven links was never workable. Edge inference drops wire traffic from continuous video to kilobytes of structured events.
Latency for floor-actionable signals. Pick-face stockouts and putaway errors are only useful if surfaced in near real time. Round-tripping inference to a central cloud added unacceptable delay during connectivity dips.
The same five-layer metrology pipeline runs server-side behind a cloud API in our consumer-facing sizing work. The architecture follows the constraint set; the measurement discipline does not change.
Each depot operates as an independent edge node. A central connectivity outage does not stop measurement, and it does not produce central blind spots when the link returns.
During an outage, CV inference continues locally. Pick-face fill state, putaway confirmation, inbound cube and floor inventory keep updating against the depot's local view. Structured measurement and variance events are written to a local buffer with store-and-forward semantics. Site dashboards and floor-facing alerts fire from the edge node itself, so floor staff are not blocked.
On reconnection, buffered events sync to the central reconciliation engine in order. Variances raised during the outage land in the same exception queue as live ones, with the original event timestamp preserved. No central blind spot, no silent data loss.
Most positions in the estate are monocular CCTV. Depth-capable sensors exist only at receiving and a handful of high-value pick zones. Recovering real-world dimensions from monocular imagery is solvable when scene geometry is calibrated.
Three signals combine to recover depth: a calibrated ground plane that locks the pixel-to-millimetre relationship at the depth ranges the camera sees; in-frame reference objects at known scale (standard totes and pallet footprints, plus fiducial markers placed at receiving) that anchor calibration and keep it self-correcting over time; and multi-view fusion when an object passes more than one camera, so observations are combined into a single volumetric estimate.
Where depth sensors are present we use them directly. Where they are not, the monocular pipeline produces measurements with a confidence envelope, and low-confidence cases queue for human review rather than write back blindly.
Each depot is a self-contained edge unit. Adding sites is additive, not architectural.
Inference, buffering and local dashboards run per depot, so adding a new site does not change the failure mode of existing sites or increase central load per site. The reconciliation engine, variance routing and analytics layer scale by region, with wave-based rollout keeping central capacity ahead of edge population. Edge nodes are built from a versioned image, which makes bringing a new site online a fleet operation rather than a bespoke deployment.
What changes between rollout waves is calibration data and per-SKU-class error budgets, not the architecture. The expansion roadmap past 500 sites does not require re-platforming.
Standard cubing pipelines assume cuboids. Real distribution estates do not. Mixed pallets, shrink-wrapped loads with overhanging cartons, irregular cases and partially-built pallets all show up at receiving and have to be measured correctly.
The pipeline isolates the object with instance segmentation rather than bounding boxes. A bounding box around a tilted or irregular load inflates measured dimensions by several centimetres; the silhouette preserves the true outline. For cuboidal items, length, width and height are derived directly from the calibrated silhouette. For non-cuboidal loads, the pipeline reconstructs a volumetric model from multi-view observations and returns volume directly, plus a bounding cuboid for slotting and load planning where downstream systems require one.
Confidence is naturally lower on irregular loads. The per-SKU-class threshold machinery handles that: a confidently-measured tote writes back to the WMS automatically; an irregular pallet with elevated uncertainty queues for one-tap confirmation.
Raw video never leaves the depot. The wire carries structured measurements and events only.
Inside the depot, behind the edge node, sit all camera feeds over RTSP, all CV inference, the local event buffer during connectivity outages, plus site dashboards and floor-facing alerts. What egresses to the central cloud is a deliberately short list:
The boundary is enforced at the edge node, not in policy alone. Bandwidth caps and outbound network rules block raw frame egress at the network layer, so accidental misconfiguration cannot push video off-site.
Lorem ipsum dolor sit amet, consectetur adipiscing elit, sed do eiusmod tempor incididunt ut labore et dolore magna aliqua. Ut enim ad minim veniam, quis nostrud exercitation ullamco laboris nisi ut aliquip ex ea commodo consequat. Duis aute irure dolor in reprehenderit in voluptate velit esse cillum dolore eu fugiat nulla pariatur.
Block quote
Ordered list
Unordered list
Bold text
Emphasis
Superscript
Subscript